
Page 238 - Defrosting for Air Source Heat Pump
P. 238
Energy transfer during defrosting 233
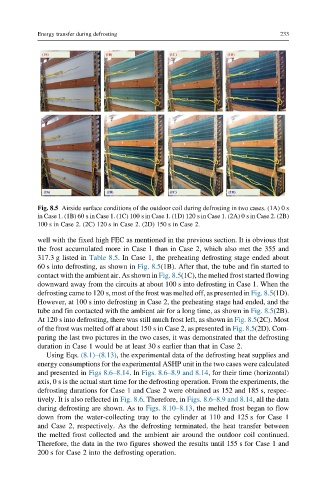
Fig. 8.5 Airside surface conditions of the outdoor coil during defrosting in two cases. (1A) 0 s
in Case 1. (1B) 60 s in Case 1. (1C) 100 s in Case 1. (1D) 120 s in Case 1. (2A) 0 s in Case 2. (2B)
100 s in Case 2. (2C) 120 s in Case 2. (2D) 150 s in Case 2.
well with the fixed high FEC as mentioned in the previous section. It is obvious that
the frost accumulated more in Case 1 than in Case 2, which also met the 355 and
317.3 g listed in Table 8.5. In Case 1, the preheating defrosting stage ended about
60 s into defrosting, as shown in Fig. 8.5(1B). After that, the tube and fin started to
contact with the ambient air. As shown in Fig. 8.5(1C), the melted frost started flowing
downward away from the circuits at about 100 s into defrosting in Case 1. When the
defrosting came to 120 s, most of the frost was melted off, as presented in Fig. 8.5(1D).
However, at 100 s into defrosting in Case 2, the preheating stage had ended, and the
tube and fin contacted with the ambient air for a long time, as shown in Fig. 8.5(2B).
At 120 s into defrosting, there was still much frost left, as shown in Fig. 8.5(2C). Most
of the frost was melted off at about 150 s in Case 2, as presented in Fig. 8.5(2D). Com-
paring the last two pictures in the two cases, it was demonstrated that the defrosting
duration in Case 1 would be at least 30 s earlier than that in Case 2.
Using Eqs. (8.1)–(8.13), the experimental data of the defrosting heat supplies and
energy consumptions for the experimental ASHP unit in the two cases were calculated
and presented in Figs 8.6–8.14.In Figs. 8.6–8.9 and 8.14, for their time (horizontal)
axis, 0 s is the actual start time for the defrosting operation. From the experiments, the
defrosting durations for Case 1 and Case 2 were obtained as 152 and 185 s, respec-
tively. It is also reflected in Fig. 8.6. Therefore, in Figs. 8.6–8.9 and 8.14, all the data
during defrosting are shown. As to Figs. 8.10–8.13, the melted frost began to flow
down from the water-collecting tray to the cylinder at 110 and 125 s for Case 1
and Case 2, respectively. As the defrosting terminated, the heat transfer between
the melted frost collected and the ambient air around the outdoor coil continued.
Therefore, the data in the two figures showed the results until 155 s for Case 1 and
200 s for Case 2 into the defrosting operation.