
Page 275 - Defrosting for Air Source Heat Pump
P. 275
Defrosting control strategy 269
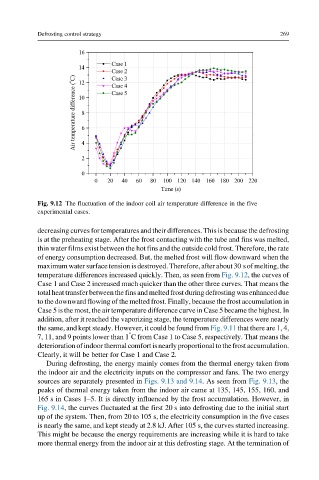
Fig. 9.12 The fluctuation of the indoor coil air temperature difference in the five
experimental cases.
decreasing curves for temperatures and their differences. This is because the defrosting
is at the preheating stage. After the frost contacting with the tube and fins was melted,
thin water films exist between the hot fins and the outside cold frost. Therefore, the rate
of energy consumption decreased. But, the melted frost will flow downward when the
maximum water surface tension is destroyed. Therefore, after about 30 s of melting, the
temperature differences increased quickly. Then, as seen from Fig. 9.12, the curves of
Case 1 and Case 2 increased much quicker than the other three curves. That means the
total heat transfer betweenthe fins and melted frost during defrosting was enhanced due
to the downward flowing of the melted frost. Finally, because the frost accumulation in
Case 5 is the most, the air temperature difference curve in Case 5 became the highest. In
addition, after it reached the vaporizing stage, the temperature differences were nearly
the same, and kept steady. However, it could be found from Fig. 9.11 that there are 1, 4,
°
7, 11, and 9 points lower than 1 C from Case 1 to Case 5, respectively. That means the
deteriorationofindoorthermalcomfortisnearlyproportionaltothefrostaccumulation.
Clearly, it will be better for Case 1 and Case 2.
During defrosting, the energy mainly comes from the thermal energy taken from
the indoor air and the electricity inputs on the compressor and fans. The two energy
sources are separately presented in Figs. 9.13 and 9.14. As seen from Fig. 9.13, the
peaks of thermal energy taken from the indoor air came at 135, 145, 155, 160, and
165 s in Cases 1–5. It is directly influenced by the frost accumulation. However, in
Fig. 9.14, the curves fluctuated at the first 20 s into defrosting due to the initial start
up of the system. Then, from 20 to 105 s, the electricity consumption in the five cases
is nearly the same, and kept steady at 2.8 kJ. After 105 s, the curves started increasing.
This might be because the energy requirements are increasing while it is hard to take
more thermal energy from the indoor air at this defrosting stage. At the termination of