
Page 270 - Defrosting for Air Source Heat Pump
P. 270
264 Defrosting for Air Source Heat Pump
Table 9.2 Experimental results in the five experimental cases
Time of Time of the melted frost Mass of the
preheating stage flowing from Defrosting melted frost
No. terminated (s) water-collecting tray (s) duration (s) collected (g)
Case 1 39 89 160 763
Case 2 40 101 179 930
Case 3 43 108 193 962
Case 4 87 118 199 993
Case 5 102 127 208 1051
when the melted frost started flowing away from the water-collecting Cylinder D. As
observed in Fig. 9.4(1C)–(5C), the white dash lines show the conditions of frost melt-
ing. They are at 89, 101, 108, 118, and 127 s into defrosting in Cases 1–5, respectively.
These differences all result from different frost accumulations in the five cases.
Finally, the total masses of melted frost collected were 763, 930, 962, 993, and
1051 g in Cases 1–5, respectively. These experimental results are summarized in
Table 9.2. It could be demonstrated that the frost accumulation is not proportional
to the frosting duration. This also reflects the inaccuracy of a time-based defrosting
initiation control strategy. Therefore, experimentally investigating the frost accumu-
lation influence on the RCD performance for an ASHP unit is meaningful.
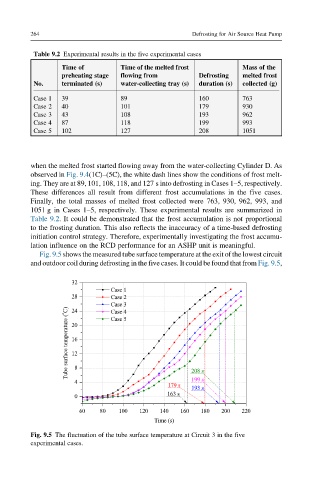
Fig. 9.5 shows the measured tube surface temperature at the exit of the lowest circuit
and outdoor coil during defrosting in the five cases. It could be found that from Fig. 9.5,
Fig. 9.5 The fluctuation of the tube surface temperature at Circuit 3 in the five
experimental cases.