
Page 273 - Defrosting for Air Source Heat Pump
P. 273
Defrosting control strategy 267
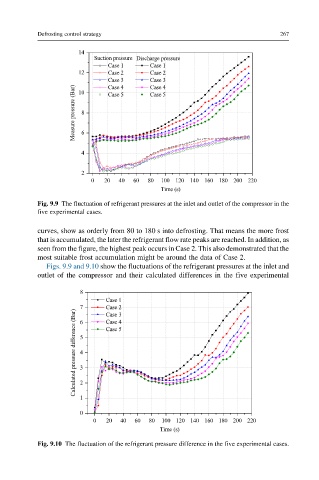
Fig. 9.9 The fluctuation of refrigerant pressures at the inlet and outlet of the compressor in the
five experimental cases.
curves, show as orderly from 80 to 180 s into defrosting. That means the more frost
that is accumulated, the later the refrigerant flow rate peaks are reached. In addition, as
seen from the figure, the highest peak occurs in Case 2. This also demonstrated that the
most suitable frost accumulation might be around the data of Case 2.
Figs. 9.9 and 9.10 show the fluctuations of the refrigerant pressures at the inlet and
outlet of the compressor and their calculated differences in the five experimental
Fig. 9.10 The fluctuation of the refrigerant pressure difference in the five experimental cases.