
Page 271 - Defrosting for Air Source Heat Pump
P. 271
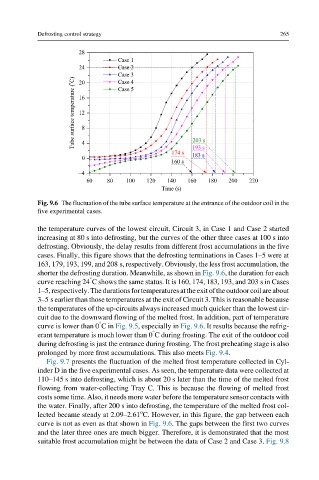
Defrosting control strategy                                       265


           Fig. 9.6 The fluctuation of the tube surface temperature at the entrance of the outdoor coil in the
           five experimental cases.

           the temperature curves of the lowest circuit, Circuit 3, in Case 1 and Case 2 started
           increasing at 80 s into defrosting, but the curves of the other three cases at 100 s into
           defrosting. Obviously, the delay results from different frost accumulations in the five
           cases. Finally, this figure shows that the defrosting terminations in Cases 1–5 were at
           163, 179, 193, 199, and 208 s, respectively. Obviously, the less frost accumulation, the
           shorter the defrosting duration. Meanwhile, as shown in Fig. 9.6, the duration for each
                         °
           curve reaching 24 C shows the same status. It is 160, 174, 183, 193, and 203 s in Cases
           1–5,respectively.Thedurationsfortemperaturesattheexitoftheoutdoorcoilareabout
           3–5 s earlier than those temperatures at the exit of Circuit 3. This is reasonable because
           the temperatures of the up-circuits always increased much quicker than the lowest cir-
           cuit due to the downward flowing of the melted frost. In addition, part of temperature
                            °
           curve is lower than 0 Cin Fig. 9.5, especially in Fig. 9.6. It results because the refrig-
                                          °
           erant temperature is much lower than 0 C during frosting. The exit of the outdoor coil
           during defrosting is just the entrance during frosting. The frost preheating stage is also
           prolonged by more frost accumulations. This also meets Fig. 9.4.
              Fig. 9.7 presents the fluctuation of the melted frost temperature collected in Cyl-
           inder D in the five experimental cases. As seen, the temperature data were collected at
           110–145 s into defrosting, which is about 20 s later than the time of the melted frost
           flowing from water-collecting Tray C. This is because the flowing of melted frost
           costs some time. Also, it needs more water before the temperature sensor contacts with
           the water. Finally, after 200 s into defrosting, the temperature of the melted frost col-
                                       o
           lected became steady at 2.09–2.61 C. However, in this figure, the gap between each
           curve is not as even as that shown in Fig. 9.6. The gaps between the first two curves
           and the later three ones are much bigger. Therefore, it is demonstrated that the most
           suitable frost accumulation might be between the data of Case 2 and Case 3. Fig. 9.8