
Page 267 - Defrosting for Air Source Heat Pump
P. 267
Defrosting control strategy 261
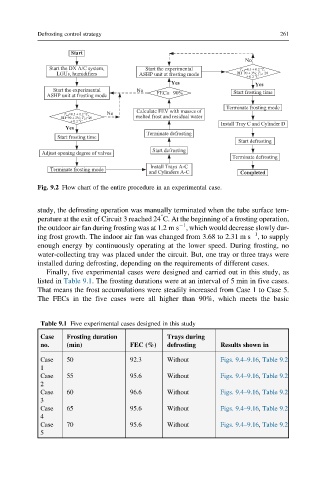
Fig. 9.2 Flow chart of the entire procedure in an experimental case.
study, the defrosting operation was manually terminated when the tube surface tem-
°
perature at the exit of Circuit 3 reached 24 C. At the beginning of a frosting operation,
1
the outdoor air fan during frosting was at 1.2 m s , which would decrease slowly dur-
1
ing frost growth. The indoor air fan was changed from 3.68 to 2.31 m s , to supply
enough energy by continuously operating at the lower speed. During frosting, no
water-collecting tray was placed under the circuit. But, one tray or three trays were
installed during defrosting, depending on the requirements of different cases.
Finally, five experimental cases were designed and carried out in this study, as
listed in Table 9.1. The frosting durations were at an interval of 5 min in five cases.
That means the frost accumulations were steadily increased from Case 1 to Case 5.
The FECs in the five cases were all higher than 90%, which meets the basic
Table 9.1 Five experimental cases designed in this study
Case Frosting duration Trays during
no. (min) FEC (%) defrosting Results shown in
Case 50 92.3 Without Figs. 9.4–9.16, Table 9.2
1
Case 55 95.6 Without Figs. 9.4–9.16, Table 9.2
2
Case 60 96.6 Without Figs. 9.4–9.16, Table 9.2
3
Case 65 95.6 Without Figs. 9.4–9.16, Table 9.2
4
Case 70 95.6 Without Figs. 9.4–9.16, Table 9.2
5