
Page 280 - Defrosting for Air Source Heat Pump
P. 280
274 Defrosting for Air Source Heat Pump
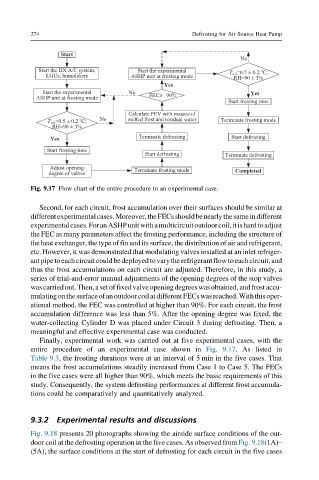
Fig. 9.17 Flow chart of the entire procedure in an experimental case.
Second, for each circuit, frost accumulation over their surfaces should be similar at
differentexperimentalcases.Moreover,theFECsshouldbenearlythesameindifferent
experimentalcases.ForanASHPunitwithamulticircuitoutdoorcoil,itishardtoadjust
the FEC as many parameters affect the frosting performance, including the structure of
the heat exchanger, the type of fin and its surface, the distribution of air and refrigerant,
etc. However, it was demonstrated that modulating valves installed at an inlet refriger-
antpipetoeachcircuitcouldbedeployedtovarytherefrigerantflowtoeach circuit, and
thus the frost accumulations on each circuit are adjusted. Therefore, in this study, a
series of trial-and-error manual adjustments of the opening degrees of the stop valves
was carried out.Then,a set of fixed valve opening degreeswas obtained, and frost accu-
mulatingonthesurfaceofanoutdoorcoilatdifferentFECswasreached.Withthisoper-
ational method, the FEC was controlled at higher than 90%. For each circuit, the frost
accumulation difference was less than 5%. After the opening degree was fixed, the
water-collecting Cylinder D was placed under Circuit 3 during defrosting. Then, a
meaningful and effective experimental case was conducted.
Finally, experimental work was carried out at five experimental cases, with the
entire procedure of an experimental case shown in Fig. 9.17. As listed in
Table 9.3, the frosting durations were at an interval of 5 min in the five cases. That
means the frost accumulations steadily increased from Case 1 to Case 5. The FECs
in the five cases were all higher than 90%, which meets the basic requirements of this
study. Consequently, the system defrosting performances at different frost accumula-
tions could be comparatively and quantitatively analyzed.
9.3.2 Experimental results and discussions
Fig. 9.18 presents 20 photographs showing the airside surface conditions of the out-
door coil at the defrosting operation in the five cases. As observed from Fig. 9.18(1A)–
(5A), the surface conditions at the start of defrosting for each circuit in the five cases