
Page 281 - Defrosting for Air Source Heat Pump
P. 281
Defrosting control strategy 275
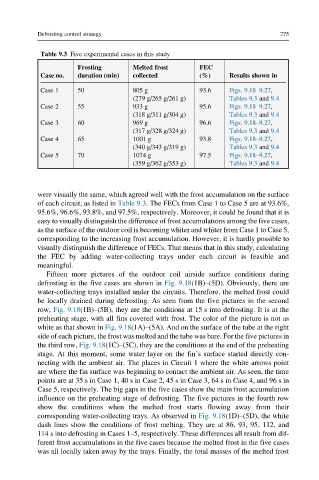
Table 9.3 Five experimental cases in this study
Frosting Melted frost FEC
Case no. duration (min) collected (%) Results shown in
Case 1 50 805 g 93.6 Figs. 9.18–9.27,
(279 g/265 g/261 g) Tables 9.3 and 9.4
Case 2 55 933 g 95.6 Figs. 9.18–9.27,
(318 g/311 g/304 g) Tables 9.3 and 9.4
Case 3 60 969 g 96.6 Figs. 9.18–9.27,
(317 g/328 g/324 g) Tables 9.3 and 9.4
Case 4 65 1001 g 93.8 Figs. 9.18–9.27,
(340 g/343 g/319 g) Tables 9.3 and 9.4
Case 5 70 1074 g 97.5 Figs. 9.18–9.27,
(359 g/362 g/353 g) Tables 9.3 and 9.4
were visually the same, which agreed well with the frost accumulation on the surface
of each circuit, as listed in Table 9.3. The FECs from Case 1 to Case 5 are at 93.6%,
95.6%, 96.6%, 93.8%, and 97.5%, respectively. Moreover, it could be found that it is
easy to visually distinguish the difference of frost accumulations among the five cases,
as the surface of the outdoor coil is becoming whiter and whiter from Case 1 to Case 5,
corresponding to the increasing frost accumulation. However, it is hardly possible to
visually distinguish the difference of FECs. That means that in this study, calculating
the FEC by adding water-collecting trays under each circuit is feasible and
meaningful.
Fifteen more pictures of the outdoor coil airside surface conditions during
defrosting in the five cases are shown in Fig. 9.18(1B)–(5D). Obviously, there are
water-collecting trays installed under the circuits. Therefore, the melted frost could
be locally drained during defrosting. As seen from the five pictures in the second
row, Fig. 9.18(1B)–(5B), they are the conditions at 15 s into defrosting. It is at the
preheating stage, with all fins covered with frost. The color of the picture is not as
white as that shown in Fig. 9.18(1A)–(5A). And on the surface of the tube at the right
side of each picture, the frost was melted and the tube was bare. For the five pictures in
the third row, Fig. 9.18(1C)–(5C), they are the conditions at the end of the preheating
stage. At this moment, some water layer on the fin’s surface started directly con-
necting with the ambient air. The places in Circuit 1 where the white arrows point
are where the fin surface was beginning to contact the ambient air. As seen, the time
points are at 35 s in Case 1, 40 s in Case 2, 45 s in Case 3, 64 s in Case 4, and 96 s in
Case 5, respectively. The big gaps in the five cases show the main frost accumulation
influence on the preheating stage of defrosting. The five pictures in the fourth row
show the conditions when the melted frost starts flowing away from their
corresponding water-collecting trays. As observed in Fig. 9.18(1D)–(5D), the white
dash lines show the conditions of frost melting. They are at 86, 93, 95, 112, and
114 s into defrosting in Cases 1–5, respectively. These differences all result from dif-
ferent frost accumulations in the five cases because the melted frost in the five cases
was all locally taken away by the trays. Finally, the total masses of the melted frost