
Page 285 - Defrosting for Air Source Heat Pump
P. 285
Defrosting control strategy 279
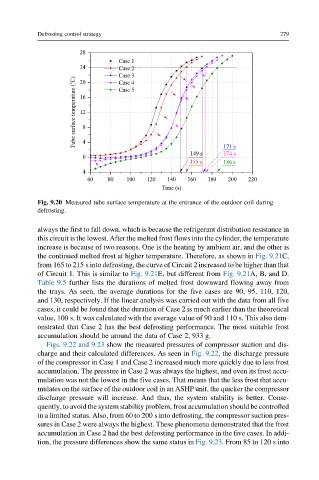
Fig. 9.20 Measured tube surface temperature at the entrance of the outdoor coil during
defrosting.
always the first to fall down, which is because the refrigerant distribution resistance in
this circuit is the lowest. After the melted frost flows into the cylinder, the temperature
increase is because of two reasons. One is the heating by ambient air, and the other is
the continued melted frost at higher temperature. Therefore, as shown in Fig. 9.21C,
from 165 to 215 s into defrosting, the curve of Circuit 2 increased to be higher than that
of Circuit 1. This is similar to Fig. 9.21E, but different from Fig. 9.21A, B, and D.
Table 9.5 further lists the durations of melted frost downward flowing away from
the trays. As seen, the average durations for the five cases are 90, 95, 110, 120,
and 130, respectively. If the linear analysis was carried out with the data from all five
cases, it could be found that the duration of Case 2 is much earlier than the theoretical
value, 100 s. It was calculated with the average value of 90 and 110 s. This also dem-
onstrated that Case 2 has the best defrosting performance. The most suitable frost
accumulation should be around the data of Case 2, 933 g.
Figs. 9.22 and 9.23 show the measured pressures of compressor suction and dis-
charge and their calculated differences. As seen in Fig. 9.22, the discharge pressure
of the compressor in Case 1 and Case 2 increased much more quickly due to less frost
accumulation. The pressure in Case 2 was always the highest, and even its frost accu-
mulation was not the lowest in the five cases. That means that the less frost that accu-
mulates on the surface of the outdoor coil in an ASHP unit, the quicker the compressor
discharge pressure will increase. And thus, the system stability is better. Conse-
quently, to avoid the system stability problem, frost accumulation should be controlled
in a limited status. Also, from 60 to 200 s into defrosting, the compressor suction pres-
sures in Case 2 were always the highest. These phenomena demonstrated that the frost
accumulation in Case 2 had the best defrosting performance in the five cases. In addi-
tion, the pressure differences show the same status in Fig. 9.23. From 85 to 120 s into