
Page 282 - Defrosting for Air Source Heat Pump
P. 282
276 Defrosting for Air Source Heat Pump
1A 2A 3A 4A 5A
1B 2B 3B 4B 5B
1C 2C 3C 4C 5C
1D 2D 3D 4D 5D
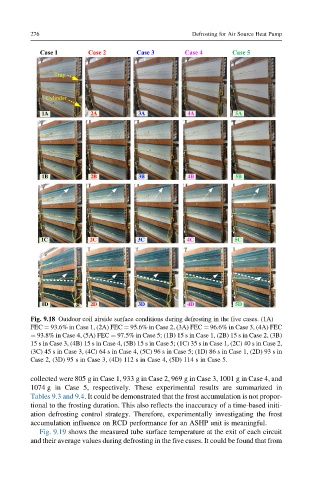
Fig. 9.18 Outdoor coil airside surface conditions during defrosting in the five cases. (1A)
FEC ¼ 93.6% in Case 1, (2A) FEC ¼ 95.6% in Case 2, (3A) FEC ¼ 96.6% in Case 3, (4A) FEC
¼ 93.8% in Case 4, (5A) FEC ¼ 97.5% in Case 5; (1B) 15 s in Case 1, (2B) 15 s in Case 2, (3B)
15 s in Case 3, (4B) 15 s in Case 4, (5B) 15 s in Case 5; (1C) 35 s in Case 1, (2C) 40 s in Case 2,
(3C) 45 s in Case 3, (4C) 64 s in Case 4, (5C) 96 s in Case 5; (1D) 86 s in Case 1, (2D) 93 s in
Case 2, (3D) 95 s in Case 3, (4D) 112 s in Case 4, (5D) 114 s in Case 5.
collected were 805 g in Case 1, 933 g in Case 2, 969 g in Case 3, 1001 g in Case 4, and
1074 g in Case 5, respectively. These experimental results are summarized in
Tables 9.3 and 9.4. It could be demonstrated that the frost accumulation is not propor-
tional to the frosting duration. This also reflects the inaccuracy of a time-based initi-
ation defrosting control strategy. Therefore, experimentally investigating the frost
accumulation influence on RCD performance for an ASHP unit is meaningful.
Fig. 9.19 shows the measured tube surface temperature at the exit of each circuit
and their average values during defrosting in the five cases. It could be found that from