
Page 284 - Defrosting for Air Source Heat Pump
P. 284
278 Defrosting for Air Source Heat Pump
(A) (B)
(C) (D)
(E) (F)
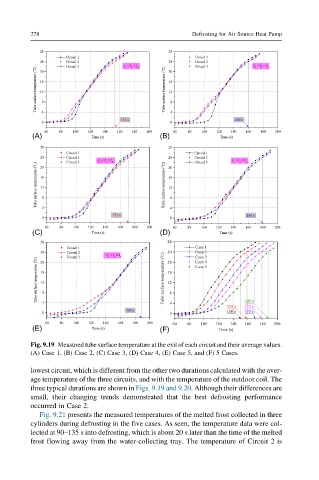
Fig. 9.19 Measured tube surface temperature at the exit of each circuit and their average values.
(A) Case 1, (B) Case 2, (C) Case 3, (D) Case 4, (E) Case 5, and (F) 5 Cases.
lowest circuit, which is different from the other two durations calculated with the aver-
age temperature of the three circuits, and with the temperature of the outdoor coil. The
three typical durations are shown in Figs. 9.19 and 9.20. Although their differences are
small, their changing trends demonstrated that the best defrosting performance
occurred in Case 2.
Fig. 9.21 presents the measured temperatures of the melted frost collected in three
cylinders during defrosting in the five cases. As seen, the temperature data were col-
lected at 90–135 s into defrosting, which is about 20 s later than the time of the melted
frost flowing away from the water-collecting tray. The temperature of Circuit 2 is