
Page 287 - Defrosting for Air Source Heat Pump
P. 287
Defrosting control strategy 281
Table 9.5 Durations of melted frost downward flowing away from trays
Case no. Circuit 1 (s) Circuit 2 (s) Circuit 3 (s) Average (s)
Case 1 105 90 95 90
Case 2 115 95 105 95
Case 3 120 110 120 110
Case 4 130 120 120 120
Case 5 135 125 135 130
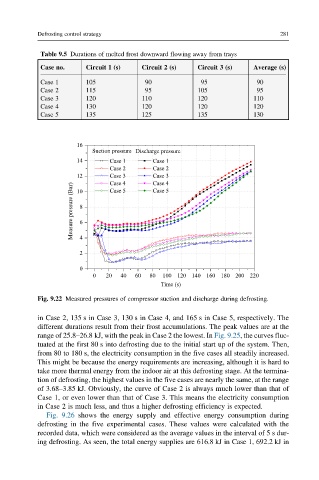
Fig. 9.22 Measured pressures of compressor suction and discharge during defrosting.
in Case 2, 135 s in Case 3, 130 s in Case 4, and 165 s in Case 5, respectively. The
different durations result from their frost accumulations. The peak values are at the
range of 25.8–26.8 kJ, with the peak in Case 2 the lowest. In Fig. 9.25, the curves fluc-
tuated at the first 80 s into defrosting due to the initial start up of the system. Then,
from 80 to 180 s, the electricity consumption in the five cases all steadily increased.
This might be because the energy requirements are increasing, although it is hard to
take more thermal energy from the indoor air at this defrosting stage. At the termina-
tion of defrosting, the highest values in the five cases are nearly the same, at the range
of 3.68–3.85 kJ. Obviously, the curve of Case 2 is always much lower than that of
Case 1, or even lower than that of Case 3. This means the electricity consumption
in Case 2 is much less, and thus a higher defrosting efficiency is expected.
Fig. 9.26 shows the energy supply and effective energy consumption during
defrosting in the five experimental cases. These values were calculated with the
recorded data, which were considered as the average values in the interval of 5 s dur-
ing defrosting. As seen, the total energy supplies are 616.8 kJ in Case 1, 692.2 kJ in