
Page 283 - Defrosting for Air Source Heat Pump
P. 283
Defrosting control strategy 277
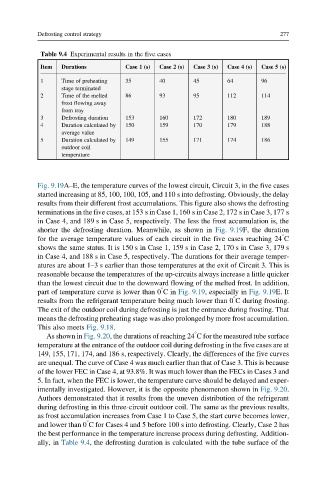
Table 9.4 Experimental results in the five cases
Item Durations Case 1 (s) Case 2 (s) Case 3 (s) Case 4 (s) Case 5 (s)
1 Time of preheating 35 40 45 64 96
stage terminated
2 Time of the melted 86 93 95 112 114
frost flowing away
from tray
3 Defrosting duration 153 160 172 180 189
4 Duration calculated by 150 159 170 179 188
average value
5 Duration calculated by 149 155 171 174 186
outdoor coil
temperature
Fig. 9.19A–E, the temperature curves of the lowest circuit, Circuit 3, in the five cases
started increasing at 85, 100, 100, 105, and 110 s into defrosting. Obviously, the delay
results from their different frost accumulations. This figure also shows the defrosting
terminations in the five cases, at 153 s in Case 1, 160 s in Case 2, 172 s in Case 3, 177 s
in Case 4, and 189 s in Case 5, respectively. The less the frost accumulation is, the
shorter the defrosting duration. Meanwhile, as shown in Fig. 9.19F, the duration
°
for the average temperature values of each circuit in the five cases reaching 24 C
shows the same status. It is 150 s in Case 1, 159 s in Case 2, 170 s in Case 3, 179 s
in Case 4, and 188 s in Case 5, respectively. The durations for their average temper-
atures are about 1–3 s earlier than those temperatures at the exit of Circuit 3. This is
reasonable because the temperatures of the up-circuits always increase a little quicker
than the lowest circuit due to the downward flowing of the melted frost. In addition,
°
part of temperature curve is lower than 0 Cin Fig. 9.19, especially in Fig. 9.19E. It
°
results from the refrigerant temperature being much lower than 0 C during frosting.
The exit of the outdoor coil during defrosting is just the entrance during frosting. That
means the defrosting preheating stage was also prolonged by more frost accumulation.
This also meets Fig. 9.18.
°
As shown in Fig. 9.20, the durations of reaching 24 C for the measured tube surface
temperature at the entrance of the outdoor coil during defrosting in the five cases are at
149, 155, 171, 174, and 186 s, respectively. Clearly, the differences of the five curves
are unequal. The curve of Case 4 was much earlier than that of Case 3. This is because
of the lower FEC in Case 4, at 93.8%. It was much lower than the FECs in Cases 3 and
5. In fact, when the FEC is lower, the temperature curve should be delayed and exper-
imentally investigated. However, it is the opposite phenomenon shown in Fig. 9.20.
Authors demonstrated that it results from the uneven distribution of the refrigerant
during defrosting in this three-circuit outdoor coil. The same as the previous results,
as frost accumulation increases from Case 1 to Case 5, the start curve becomes lower,
°
and lower than 0 C for Cases 4 and 5 before 100 s into defrosting. Clearly, Case 2 has
the best performance in the temperature increase process during defrosting. Addition-
ally, in Table 9.4, the defrosting duration is calculated with the tube surface of the