
Page 289 - Design and Operation of Heat Exchangers and their Networks
P. 289
Optimal design of heat exchanger networks 275
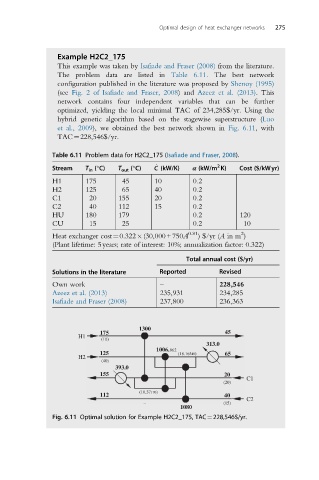
Example H2C2_175
This example was taken by Isafiade and Fraser (2008) from the literature.
The problem data are listed in Table 6.11. The best network
configuration published in the literature was proposed by Shenoy (1995)
(see Fig. 2 of Isafiade and Fraser, 2008) and Azeez et al. (2013). This
network contains four independent variables that can be further
optimized, yielding the local minimal TAC of 234,285$/yr. Using the
hybrid genetic algorithm based on the stagewise superstructure (Luo
et al., 2009), we obtained the best network shown in Fig. 6.11, with
TAC¼228,546$/yr.
Table 6.11 Problem data for H2C2_175 (Isafiade and Fraser, 2008).
2
_
Stream T in (°C) T out (°C) C (kW/K) α (kW/m K) Cost ($/kWyr)
H1 175 45 10 0.2
H2 125 65 40 0.2
C1 20 155 20 0.2
C2 40 112 15 0.2
HU 180 179 0.2 120
CU 15 25 0.2 10
2
Heat exchanger cost¼0.322 (30,000+750A 0.81 ) $/yr (A in m )
(Plant lifetime: 5years; rate of interest: 10%; annualization factor: 0.322)
Total annual cost ($/yr)
Solutions in the literature Reported Revised
Own work – 228,546
Azeez et al. (2013) 235,931 234,285
Isafiade and Fraser (2008) 237,800 236,363
1300
175 45
H1
(10)
313.0
1006. 962
125 (18.16548) 65
H2
(40)
393.0
155 20
C1
(20)
(10.37170)
112 40
C2
(15)
1080
Fig. 6.11 Optimal solution for Example H2C2_175, TAC¼228,546$/yr.