Page 297 - Design and Operation of Heat Exchangers and their Networks
P. 297

Optimal design of heat exchanger networks  283
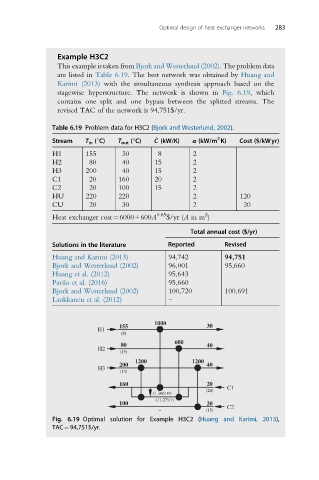


                 Example H3C2
                 This example is taken from Bjork and Westerlund (2002). The problem data
                 are listed in Table 6.19. The best network was obtained by Huang and
                 Karimi (2013) with the simultaneous synthesis approach based on the
                 stagewise hyperstructure. The network is shown in Fig. 6.19, which
                 contains one split and one bypass between the splitted streams. The
                 revised TAC of the network is 94,751$/yr.

               Table 6.19 Problem data for H3C2 (Bjork and Westerlund, 2002).
                                                            2
                                           _
               Stream   T in (°C)  T out (°C)  C (kW/K)  α (kW/m K)  Cost ($/kWyr)
               H1       155       30        8        2
               H2        80       40       15        2
               H3       200       40       15        2
               C1        20      160       20        2
               C2        20      100       15        2
               HU       220      220                 2            120
               CU        20       30                 2             20
                                           0.85         2
               Heat exchanger cost¼6000+600A  $/yr (A in m )
                                                    Total annual cost ($/yr)

               Solutions in the literature    Reported        Revised
               Huang and Karimi (2013)         94,742         94,751
               Bjork and Westerlund (2002)     96,001         95,660
               Huang et al. (2012)             95,643
               Pava ˜o et al. (2016)           95,660
               Bjork and Westerlund (2002)     100,720        100,691
               Laukkanen et al. (2012)         –


                                           1000
                                 155                     30
                           H1
                                  (8)
                                                600
                                  80                     40
                           H2
                                 (15)
                                      1200           1200
                                 200                     40
                           H3
                                 (15)
                                 160                     20
                                                         (20)  C1
                                          (1.366119)
                                           (11.27517)
                                 100                     20
                                                         (15)  C2
               Fig. 6.19 Optimal solution for Example H3C2 (Huang and Karimi, 2013),
               TAC¼94,751$/yr.
   292   293   294   295   296   297   298   299   300   301   302