
Page 303 - Design and Operation of Heat Exchangers and their Networks
P. 303
Optimal design of heat exchanger networks 289
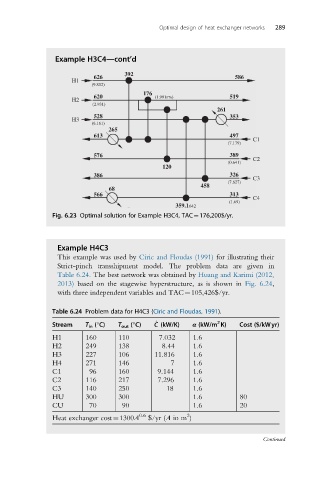
Example H3C4—cont’d
392
626 586
H1
(9.802)
176
620 (1.991076) 519
H2
(2.931)
261
528 353
H3
(6.161)
265
613 497
C1
(7.179)
576 389
C2
(0.641)
120
386 326
C3
(7.627)
458
68
566 313
C4
(1.69)
359.1 642
Fig. 6.23 Optimal solution for Example H3C4, TAC¼176,200$/yr.
Example H4C3
This example was used by Ciric and Floudas (1991) for illustrating their
Strict-pinch transshipment model. The problem data are given in
Table 6.24. The best network was obtained by Huang and Karimi (2012,
2013) based on the stagewise hyperstructure, as is shown in Fig. 6.24,
with three independent variables and TAC¼105,426$/yr.
Table 6.24 Problem data for H4C3 (Ciric and Floudas, 1991).
2
_
Stream T in (°C) T out (°C) C (kW/K) α (kW/m K) Cost ($/kWyr)
H1 160 110 7.032 1.6
H2 249 138 8.44 1.6
H3 227 106 11.816 1.6
H4 271 146 7 1.6
C1 96 160 9.144 1.6
C2 116 217 7.296 1.6
C3 140 250 18 1.6
HU 300 300 1.6 80
CU 70 90 1.6 20
0.6 2
Heat exchanger cost¼1300A $/yr (A in m )
Continued