
Page 461 - Design for Six Sigma a Roadmap for Product Development
P. 461
420 Chapter Twelve
12.2.3 What is interaction?
Let’s look at Eq. (11.2) again; if there is no interaction, it will become
y f 1 (x 1 ) f 2 (x 2 ) ε (12.4)
where f 1 (x 1 ) is a function of x 1 alone and f 1(x 2) is a function of x 2 alone;
we call Eq. (12.4) the additive model. However, if the interaction effect
is not equal to zero, then we do not have an additive model. Let’s look
at the following example.
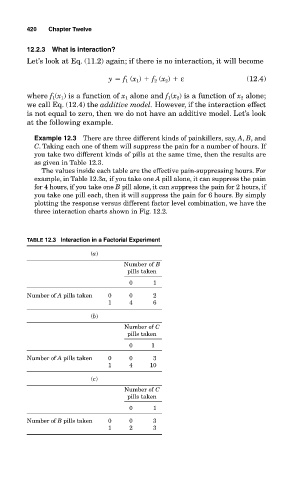
Example 12.3 There are three different kinds of painkillers, say, A, B, and
C. Taking each one of them will suppress the pain for a number of hours. If
you take two different kinds of pills at the same time, then the results are
as given in Table 12.3.
The values inside each table are the effective pain-suppressing hours. For
example, in Table 12.3a, if you take one A pill alone, it can suppress the pain
for 4 hours, if you take one B pill alone, it can suppress the pain for 2 hours, if
you take one pill each, then it will suppress the pain for 6 hours. By simply
plotting the response versus different factor level combination, we have the
three interaction charts shown in Fig. 12.2.
TABLE 12.3 Interaction in a Factorial Experiment
(a)
Number of B
pills taken
0 1
Number of A pills taken 0 0 2
1 4 6
(b)
Number of C
pills taken
0 1
Number of A pills taken 0 0 3
1 4 10
(c)
Number of C
pills taken
0 1
Number of B pills taken 0 0 3
1 2 3