
Page 466 - Design for Six Sigma a Roadmap for Product Development
P. 466
Fundamentals of Experimental Design 425
305 Glass
1
295 2
285
275
Mean 265
255
245
235
225
1 2 3
Phosphor
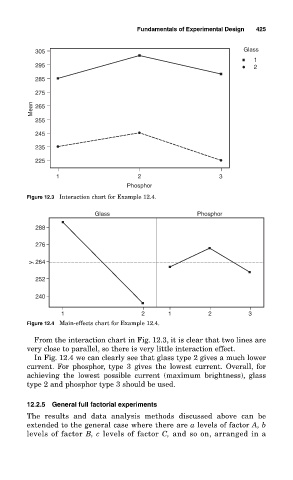
Figure 12.3 Interaction chart for Example 12.4.
Glass Phosphor
288
276
y 264
252
240
1 2 1 2 3
Figure 12.4 Main-effects chart for Example 12.4.
From the interaction chart in Fig. 12.3, it is clear that two lines are
very close to parallel, so there is very little interaction effect.
In Fig. 12.4 we can clearly see that glass type 2 gives a much lower
current. For phosphor, type 3 gives the lowest current. Overall, for
achieving the lowest possible current (maximum brightness), glass
type 2 and phosphor type 3 should be used.
12.2.5 General full factorial experiments
The results and data analysis methods discussed above can be
extended to the general case where there are a levels of factor A, b
levels of factor B, c levels of factor C, and so on, arranged in a