
Page 463 - Design for Six Sigma a Roadmap for Product Development
P. 463
422 Chapter Twelve
Clearly, the effects of painkillers A and B are additive, since the effect of
taking both A and B is equal to the summation of effects of taking A and B
separately. The corresponding interaction chart is parallel. But for A and C or
B and C, the effects are not additive. If the effect of taking both A and C
together is more than the added effects of taking them separately, we call it
synergistic interaction; if the effect of taking B and C together is less than the
added effects of taking them separately, we call it antisynergistic interaction.
In Fig. 12.2b and c, the corresponding interaction charts are not parallel.
12.2.4 Analysis of variance (ANOVA)
For any set of real experimental data, for example, the data from
Table 12.2, the data most likely vary. (What would happen if all the
data were the same?) Some variability of the data might be caused by
changing of experimental factors and some might be due to unknown
causes or experimental measurement errors. The ANOVA method
attempts to accomplish the following:
1. Decompose the variation of your experimental data according to
possible sources; the source could be the main effect, interaction, or
experimental error.
2. Quantify the amount of variation due to each source.
3. Identify which main effects and interactions have significant effects
on variation of data.
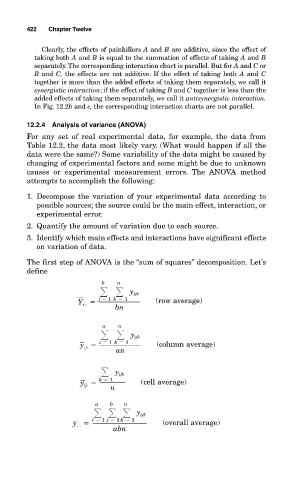
The first step of ANOVA is the “sum of squares” decomposition. Let’s
define
b n
y ijk
j 1 k 1
Y .. (row average)
i
bn
a n
y ijk
i 1 k 1
y. j. (column average)
an
y ijk
k 1
y . (cell average)
ij n
a b n
y ijk
i 1 j 1 k 1
y... (overall average)
abn