
Page 465 - Design for Six Sigma a Roadmap for Product Development
P. 465
424 Chapter Twelve
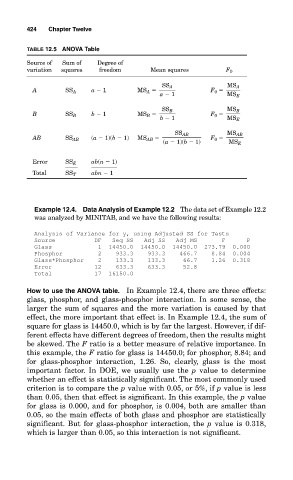
TABLE 12.5 ANOVA Table
Source of Sum of Degree of
variation squares freedom Mean squares F 0
SS A MS A
A SS A a 1 MS A F 0
a 1 MS E
SS B MS B
B SS B b 1 MS B F 0
b 1 MS E
SS AB MS AB
AB SS AB (a 1)(b 1) MS AB F 0
(a 1)(b 1) MS E
Error SS E ab(n 1)
Total SS T abn 1
Example 12.4. Data Analysis of Example 12.2 The data set of Example 12.2
was analyzed by MINITAB, and we have the following results:
Analysis of Variance for y, using Adjusted SS for Tests
Source DF Seq SS Adj SS Adj MS F P
Glass 1 14450.0 14450.0 14450.0 273.79 0.000
Phosphor 2 933.3 933.3 466.7 8.84 0.004
Glass*Phosphor 2 133.3 133.3 66.7 1.26 0.318
Error 12 633.3 633.3 52.8
Total 17 16150.0
How to use the ANOVA table. In Example 12.4, there are three effects:
glass, phosphor, and glass-phosphor interaction. In some sense, the
larger the sum of squares and the more variation is caused by that
effect, the more important that effect is. In Example 12.4, the sum of
square for glass is 14450.0, which is by far the largest. However, if dif-
ferent effects have different degrees of freedom, then the results might
be skewed. The F ratio is a better measure of relative importance. In
this example, the F ratio for glass is 14450.0; for phosphor, 8.84; and
for glass-phosphor interaction, 1.26. So, clearly, glass is the most
important factor. In DOE, we usually use the p value to determine
whether an effect is statistically significant. The most commonly used
criterion is to compare the p value with 0.05, or 5%, if p value is less
than 0.05, then that effect is significant. In this example, the p value
for glass is 0.000, and for phosphor, is 0.004, both are smaller than
0.05, so the main effects of both glass and phosphor are statistically
significant. But for glass-phosphor interaction, the p value is 0.318,
which is larger than 0.05, so this interaction is not significant.