
Page 476 - Design for Six Sigma a Roadmap for Product Development
P. 476
Fundamentals of Experimental Design 435
A: A
B: B
B
C: C
BC
A
C
AC
ABC
AB
0 5 10 15
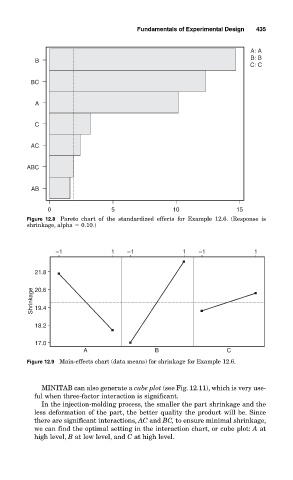
Figure 12.8 Pareto chart of the standardized effects for Example 12.6. (Response is
shrinkage, alpha 0.10.)
–1 1 –1 1 –1 1
21.8
Shrinkage 20.6
19.4
18.2
17.0
A B C
Figure 12.9 Main-effects chart (data means) for shrinkage for Example 12.6.
MINITAB can also generate a cube plot (see Fig. 12.11), which is very use-
ful when three-factor interaction is significant.
In the injection-molding process, the smaller the part shrinkage and the
less deformation of the part, the better quality the product will be. Since
there are significant interactions, AC and BC, to ensure minimal shrinkage,
we can find the optimal setting in the interaction chart, or cube plot: A at
high level, B at low level, and C at high level.