
Page 473 - Design for Six Sigma a Roadmap for Product Development
P. 473
432 Chapter Twelve
A B
31
27
y
23
19
15
–1 1 –1 1
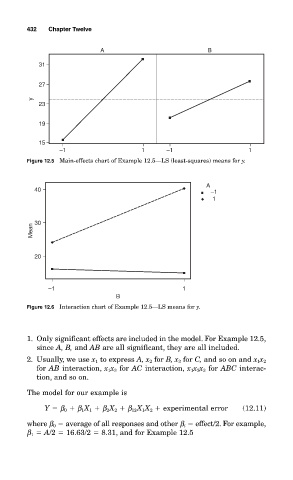
Figure 12.5 Main-effects chart of Example 12.5—LS (least-squares) means for y.
A
40 –1
1
30
Mean
20
–1 1
B
Figure 12.6 Interaction chart of Example 12.5—LS means for y.
1. Only significant effects are included in the model. For Example 12.5,
since A, B, and AB are all significant, they are all included.
2. Usually, we use x 1 to express A, x 2 for B, x 3 for C, and so on and x 1 x 2
for AB interaction, x 1 x 3 for AC interaction, x 1 x 2 x 3 for ABC interac-
tion, and so on.
The model for our example is
Y β 0 β 1 X 1 β 2 X 2 β 12 X 1 X 2 experimental error (12.11)
where β 0 average of all responses and other β i effect/2. For example,
β 1 A/2 16.63/2 8.31, and for Example 12.5