
Page 474 - Design for Six Sigma a Roadmap for Product Development
P. 474
Fundamentals of Experimental Design 433
Y 23.8313 8.31x 1 3.77x 2 4.36x 1 x 2
where x 1 and x 2 are coded values.
Step 7: Determine optimal settings. Depending on the objective of the
problem, we can determine the optimum setting of the factor levels by
examining the main-effects chart and interaction chart; if there is no
interaction, the optimal setting can be determined by looking at one fac-
tor at a time. If there are interactions, then we have to look at the inter-
action chart. For the problem above, since AB interaction is significant,
we have to find optimal by studying the AB interaction. From the inter-
action chart, if the vibration level is “the smaller, the better,” then A at
low level and B at high level will give the lowest possible vibrations.
12.3.4 2 factorial experiment
3
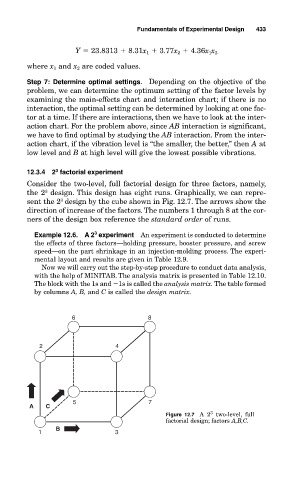
Consider the two-level, full factorial design for three factors, namely,
3
the 2 design. This design has eight runs. Graphically, we can repre-
3
sent the 2 design by the cube shown in Fig. 12.7. The arrows show the
direction of increase of the factors. The numbers 1 through 8 at the cor-
ners of the design box reference the standard order of runs.
3
Example 12.6. A 2 experiment An experiment is conducted to determine
the effects of three factors—holding pressure, booster pressure, and screw
speed—on the part shrinkage in an injection-molding process. The experi-
mental layout and results are given in Table 12.9.
Now we will carry out the step-by-step procedure to conduct data analysis,
with the help of MINITAB. The analysis matrix is presented in Table 12.10.
The block with the 1s and 1s is called the analysis matrix. The table formed
by columns A, B, and C is called the design matrix.
6 8
2 4
5 7
A C
3
Figure 12.7 A 2 two-level, full
factorial design; factors A,B,C.
B
1 3