
Page 475 - Design for Six Sigma a Roadmap for Product Development
P. 475
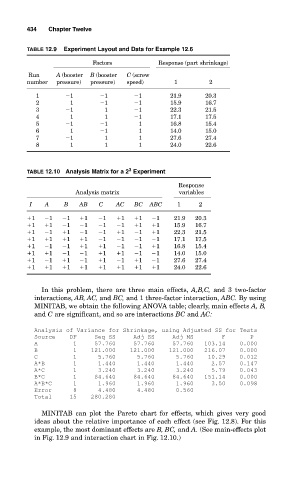
434   Chapter Twelve

           TABLE 12.9  Experiment Layout and Data for Example 12.6

                             Factors           Response (part shrinkage)
            Run    A (booster  B (booster  C (screw
           number  pressure)  pressure)  speed)    1         2
              1        1        1        1        21.9      20.3
              2        1        1        1        15.9      16.7
              3        1        1        1        22.3      21.5
              4        1        1        1        17.1      17.5
              5        1        1         1       16.8      15.4
              6        1        1         1       14.0      15.0
              7        1        1         1       27.6      27.4
              8        1        1         1       24.0      22.6


                                       3
           TABLE 12.10 Analysis Matrix for a 2 Experiment
                                                     Response
                         Analysis matrix             variables
            I   A    B    AB   C    AC   BC  ABC    1     2
            1    1    1    1    1    1   1    1    21.9  20.3
            1    1    1    1    1    1   1    1    15.9  16.7
            1    1    1    1    1    1   1    1    22.3  21.5
            1    1    1    1    1    1   1    1    17.1  17.5
            1    1    1    1    1    1   1    1    16.8  15.4
            1    1    1    1    1    1   1    1    14.0  15.0
            1    1    1    1    1    1   1    1    27.6  27.4
            1    1    1    1    1    1   1    1    24.0  22.6


               In this problem, there are three main effects, A,B,C, and 3 two-factor
             interactions, AB, AC, and BC, and 1 three-factor interaction, ABC. By using
             MINITAB, we obtain the following ANOVA table; clearly, main effects A, B,
             and C are significant, and so are interactions BC and AC:

             Analysis of Variance for Shrinkage, using Adjusted SS for Tests
             Source    DF     Seq SS     Adj SS     Adj MS        F       P
             A          1     57.760     57.760     57.760   103.14    0.000
             B          1    121.000    121.000    121.000   216.07    0.000
             C          1      5.760      5.760      5.760    10.29    0.012
             A*B        1      1.440      1.440      1.440     2.57    0.147
             A*C        1      3.240      3.240      3.240     5.79    0.043
             B*C        1     84.640     84.640     84.640   151.14    0.000
             A*B*C      1      1.960      1.960      1.960     3.50    0.098
             Error      8      4.480      4.480      0.560
             Total     15    280.280

               MINITAB can plot the Pareto chart for effects, which gives very good
             ideas about the relative importance of each effect (see Fig. 12.8). For this
             example, the most dominant effects are B, BC, and A. (See main-effects plot
             in Fig. 12.9 and interaction chart in Fig. 12.10.)