
Page 477 - Design for Six Sigma a Roadmap for Product Development
P. 477
436 Chapter Twelve
–1 1 –1 1
25
A
20
1
–1
15
25
B
1 20
–1
15
C
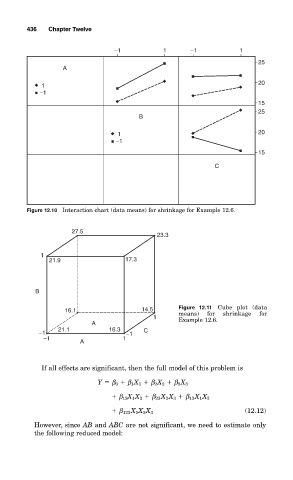
Figure 12.10 Interaction chart (data means) for shrinkage for Example 12.6.
27.5
23.3
1
21.9 17.3
B
16.1 14.5 Figure 12.11 Cube plot (data
means)
for
shrinkage
for
1 Example 12.6.
A
21.1 16.3 C
–1 –1
–1 1
A
If all effects are significant, then the full model of this problem is
Y β 0 β 1 X 1 β 2 X 2 β 3 X 3
β 12 X 1 X 2 β 23 X 2 X 3 β 13 X 1 X 3
(12.12)
β 123 X 1 X 2 X 3
However, since AB and ABC are not significant, we need to estimate only
the following reduced model: