
Page 572 - Design for Six Sigma a Roadmap for Product Development
P. 572
530 Chapter Fourteen
Pulloff force measured
Control factors at compounded noise levels
Experiment
no. A B C D N1 N2 y S/N
1 1 1 1 1 9.5 20.0 14.75 21.68
2 1 2 2 2 16.2 24.2 20.20 25.59
3 1 3 3 3 6.7 23.3 20.00 25.66
4 2 1 2 3 17.4 23.2 20.30 25.88
5 2 2 3 1 18.6 27.5 23.05 26.76
6 2 3 1 2 16.3 22.5 19.40 25.42
7 3 1 3 2 19.1 24.3 21.70 26.54
8 3 2 1 3 15.6 23.2 19.40 25.25
9 3 3 2 1 19.9 22.6 21.25 26.49
where the signal-to-noise ratio is computed by using the formula for the
larger-the-better quality characteristic:
1 n 1
S/N 10 log
n 2
i 1 y i
By using MINITAB, we can obtain the following ANOVA table for S/N and
can also compute the percentage contribution of control factors influencing
S/N (Fig. 14.21):
Analysis of Variance for S/N, using Adjusted SS for Tests
Source DF Seq SS Adj SS Adj MS F P
A 2 6.1128 6.1128 3.0564 **
B 2 2.7057 2.7057 1.3528 **
C 2 8.4751 8.4751 4.2376 **
D 2 1.2080 1.2080 0.6040 **
Error 0 0.0000 0.0000 0.0000
Total 8 18.5016
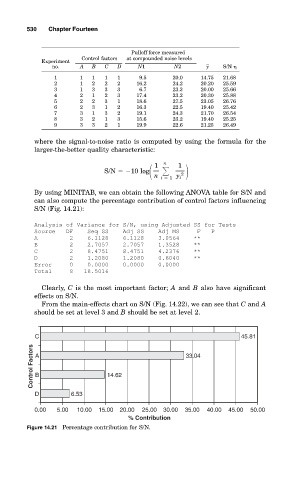
Clearly, C is the most important factor; A and B also have significant
effects on S/N.
From the main-effects chart on S/N (Fig. 14.22), we can see that C and A
should be set at level 3 and B should be set at level 2.
C 45.81
Control Factors A 14.62 33.04
B
D 6.53
0.00 5.00 10.00 15.00 20.00 25.00 30.00 35.00 40.00 45.00 50.00
% Contribution
Figure 14.21 Percentage contribution for S/N.