
Page 570 - Design for Six Sigma a Roadmap for Product Development
P. 570
528 Chapter Fourteen
SMT BP SS DD DV
7.32
7.24
y-bar 7.16
7.08
7.00
1 2 3 1 2 3 1 2 3 1 2 3 1 2 3
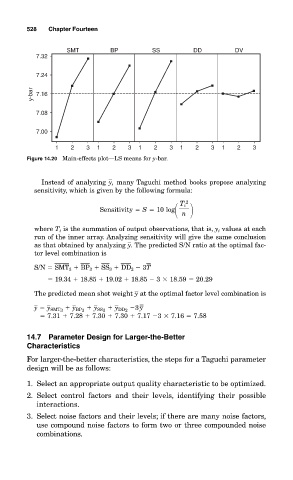
Figure 14.20 Main-effects plot—LS means for y-bar.
Instead of analyzing y, many Taguchi method books propose analyzing
sensitivity, which is given by the following formula:
2
T i
Sensitivity S 10 log
n
where T i is the summation of output observations, that is, y i values at each
run of the inner array. Analyzing sensitivity will give the same conclusion
as that obtained by analyzing y. The predicted S/N ratio at the optimal fac-
tor level combination is
S/N S M T 3 B P 3 S S 3 D D 2 3T
19.34 18.85 19.02 18.85 3
18.59 20.29
The predicted mean shot weight y at the optimal factor level combination is
y BP 3 y SS 3 y DD 2 3y
y y SMT 3
7.31 7.28 7.30 7.30 7.17 3
7.16 7.58
14.7 Parameter Design for Larger-the-Better
Characteristics
For larger-the-better characteristics, the steps for a Taguchi parameter
design will be as follows:
1. Select an appropriate output quality characteristic to be optimized.
2. Select control factors and their levels, identifying their possible
interactions.
3. Select noise factors and their levels; if there are many noise factors,
use compound noise factors to form two or three compounded noise
combinations.