
Page 573 - Design for Six Sigma a Roadmap for Product Development
P. 573
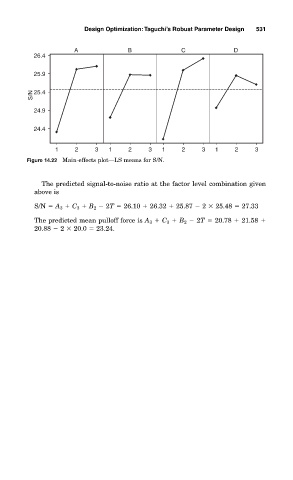
Design Optimization:Taguchi’s Robust Parameter Design  531


                        A              B             C              D
             26.4

             25.9

             S/N  25.4

             24.9

             24.4


                   1    2     3   1    2    3   1    2     3  1     2    3
           Figure 14.22 Main-effects plot—LS means for S/N.


               The predicted signal-to-noise ratio at the factor level combination given
             above is
             S/N   A 3   C 3   B 2   2T   26.10   26.32   25.87   2
 25.48   27.33
             The predicted mean pulloff force is A 3   C 3   B 2   2T   20.78   21.58
             20.88   2
 20.0   23.24.