
Page 569 - Design for Six Sigma a Roadmap for Product Development
P. 569
Design Optimization:Taguchi’s Robust Parameter Design 527
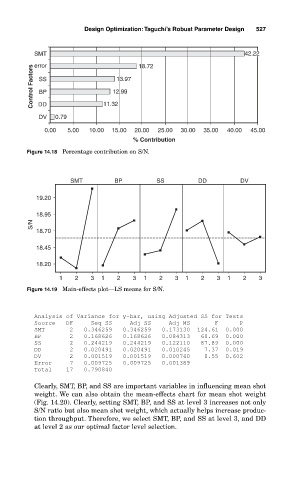
SMT 18.72 42.22
error
Control Factors SS 12.99
13.97
BP
DD
DV 0.79 11.32
0.00 5.00 10.00 15.00 20.00 25.00 30.00 35.00 40.00 45.00
% Contribution
Figure 14.18 Percentage contribution on S/N.
SMT BP SS DD DV
19.20
18.95
S/N
18.70
18.45
18.20
1 2 3 1 2 3 1 2 3 1 2 3 1 2 3
Figure 14.19 Main-effects plot—LS means for S/N.
Analysis of Variance for y-bar, using Adjusted SS for Tests
Source DF Seq SS Adj SS Adj MS F P
SMT 2 0.346259 0.346259 0.173130 124.61 0.000
BP 2 0.168626 0.168626 0.084313 60.69 0.000
SS 2 0.244219 0.244219 0.122110 87.89 0.000
DD 2 0.020491 0.020491 0.010245 7.37 0.019
DV 2 0.001519 0.001519 0.000760 0.55 0.602
Error 7 0.009725 0.009725 0.001389
Total 17 0.790840
Clearly, SMT, BP, and SS are important variables in influencing mean shot
weight. We can also obtain the mean-effects chart for mean shot weight
(Fig. 14.20). Clearly, setting SMT, BP, and SS at level 3 increases not only
S/N ratio but also mean shot weight, which actually helps increase produc-
tion throughput. Therefore, we select SMT, BP, and SS at level 3, and DD
at level 2 as our optimal factor level selection.