
Page 600 - Design for Six Sigma a Roadmap for Product Development
P. 600
Design Optimization: Advanced Taguchi Robust Parameter Design 555
A C D E H I
–15.5
–16.3
S/N –17.1
–17.9
–18.7
1 2 1 2 3 1 2 3 1 2 3 1 2 3 1 2 3
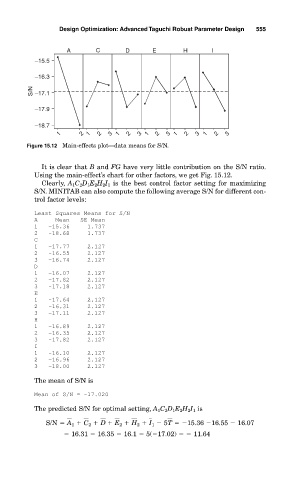
Figure 15.12 Main-effects plot—data means for S/N.
It is clear that B and FG have very little contribution on the S/N ratio.
Using the main-effect’s chart for other factors, we get Fig. 15.12.
Clearly, A 1 C 2 D 1 E 2 H 2 I 1 is the best control factor setting for maximizing
S/N. MINITAB can also compute the following average S/N for different con-
trol factor levels:
Least Squares Means for S/N
A Mean SE Mean
1 -15.36 1.737
2 -18.68 1.737
C
1 -17.77 2.127
2 -16.55 2.127
3 -16.74 2.127
D
1 -16.07 2.127
2 -17.82 2.127
3 -17.18 2.127
E
1 -17.64 2.127
2 -16.31 2.127
3 -17.11 2.127
H
1 -16.89 2.127
2 -16.35 2.127
3 -17.82 2.127
I
1 -16.10 2.127
2 -16.96 2.127
3 -18.00 2.127
The mean of S/N is
Mean of S/N = -17.020
The predicted S/N for optimal setting, A 1 C 2 D 1 E 2 H 2 I 1 is
S/N A 1 C 2 D E 2 H 2 I 1 5T 15.36 16.55 16.07
16.31 16.35 16.1 5( 17.02) 11.64