
Page 603 - Design for Six Sigma a Roadmap for Product Development
P. 603
558 Chapter Fifteen
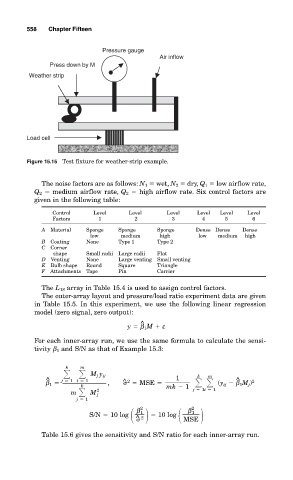
Pressure gauge
Air inflow
Press down by M
Weather strip
Load cell
Figure 15.15 Test fixture for weather-strip example.
The noise factors are as follows: N 1 wet, N 2 dry, Q 1 low airflow rate,
Q 2 medium airflow rate, Q 3 high airflow rate. Six control factors are
given in the following table:
Control Level Level Level Level Level Level
Factors 1 2 3 4 5 6
A Material Sponge Sponge Sponge Dense Dense Dense
low medium high low medium high
B Coating None Type 1 Type 2
C Corner
shape Small radii Large radii Flat
D Venting None Large venting Small venting
E Bulb shape Round Square Triangle
F Attachments Tape Pin Carrier
The L 18 array in Table 15.4 is used to assign control factors.
The outer-array layout and pressure/load ratio experiment data are given
in Table 15.5. In this experiment, we use the following linear regression
model (zero signal, zero output):
^
y β 1 M ε
For each inner-array run, we use the same formula to calculate the sensi-
tivity β 1 and S/N as that of Example 15.3:
k m
M j y ij k m
^ j 1 i 1 2 1 ^ 2
β 1 , ^ MSE
(y ij β 1 M j )
k mk 1
m
M 2 j j 1i 1
j 1
2
β 1 2
β 1
S/N 10 log 2 10 log
^
MSE
Table 15.6 gives the sensitivity and S/N ratio for each inner-array run.