
Page 608 - Design for Six Sigma a Roadmap for Product Development
P. 608
562 Chapter Fifteen
B Mean SE Mean
1 15.10 2.009
2 15.06 2.009
3 16.05 2.009
C
1 12.66 2.009
2 18.31 2.009
3 15.24 2.009
D
1 14.87 2.009
2 16.40 2.009
3 14.94 2.009
E Mean SE Mean
1 17.08 2.009
2 13.81 2.009
3 15.31 2.009
F
1 16.63 2.009
2 16.64 2.009
3 12.94 2.009
Mean of S/N 15.402
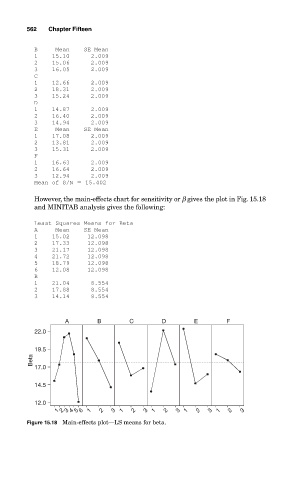
However, the main-effects chart for sensitivity or β gives the plot in Fig. 15.18
and MINITAB analysis gives the following:
Least Squares Means for Beta
A Mean SE Mean
1 15.02 12.098
2 17.33 12.098
3 21.17 12.098
4 21.72 12.098
5 18.79 12.098
6 12.08 12.098
B
1 21.04 8.554
2 17.88 8.554
3 14.14 8.554
A B C D E F
22.0
19.5
Beta
17.0
14.5
12.0
1 2 3 4 5 6 1 2 3 1 2 3 1 2 3 1 2 3 1 2 3
Figure 15.18 Main-effects plot—LS means for beta.