
Page 607 - Design for Six Sigma a Roadmap for Product Development
P. 607
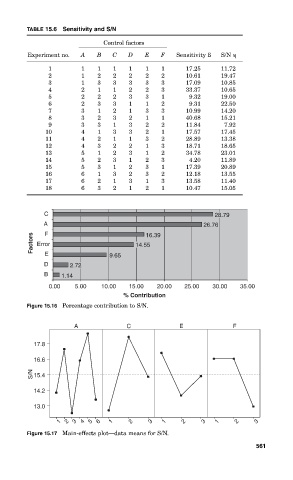
TABLE 15.6 Sensitivity and S/N

                                Control factors
            Experiment no.  A  B   C   D   E    F   Sensitivity ß  S/N
                 1        1    1   1   1    1   1      17.25    11.72
                 2        1    2   2   2    2   2      10.61    19.47
                 3        1    3   3   3    3   3      17.09    10.85
                 4        2    1   1   2    2   3      33.37    10.65
                 5        2    2   2   3    3   1      9.32     19.00
                 6        2    3   3   1    1   2      9.31     22.50
                 7        3    1   2   1    3   3      10.99    14.20
                 8        3    2   3   2    1   1      40.68    15.21
                 9        3    3   1   3    2   2      11.84     7.92
                10        4    1   3   3    2   1      17.57    17.45
                11        4    2   1   1    3   2      28.89    13.38
                12        4    3   2   2    1   3      18.71    18.65
                13        5    1   2   3    1   2      34.78    23.01
                14        5    2   3   1    2   3      4.20     11.89
                15        5    3   1   2    3   1      17.39    20.89
                16        6    1   3   2    3   2      12.18    13.55
                17        6    2   1   3    1   3      13.58    11.40
                18        6    3   2   1    2   1      10.47    15.05


                C                                             28.79
                A                                          26.76
                F
             Factors  Error              14.55
                                            16.39
                E
                D      2.72       9.65
                B    1.14
                 0.00   5.00    10.00  15.00   20.00  25.00   30.00  35.00
                                      % Contribution
           Figure 15.16 Percentage contribution to S/N.

                        A             C              E             F

             17.8

             16.6
             S/N  15.4

             14.2

             13.0
                    1  2  3  4  5  6  1  2   3   1    2    3   1    2     3

           Figure 15.17 Main-effects plot—data means for S/N.
                                                                          561