Page 604 - Design for Six Sigma a Roadmap for Product Development
P. 604

Design Optimization: Advanced Taguchi Robust Parameter Design  559

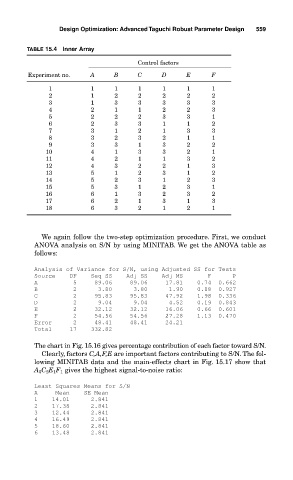
           TABLE 15.4 Inner Array

                                         Control factors
            Experiment no.   A     B     C      D      E     F
                 1           1     1      1     1      1      1
                 2           1     2      2     2      2      2
                 3           1     3      3     3      3      3
                 4           2     1      1     2      2      3
                 5           2     2      2     3      3      1
                 6           2     3      3     1      1      2
                 7           3     1      2     1      3      3
                 8           3     2      3     2      1      1
                 9           3     3      1     3      2      2
                 10          4     1      3     3      2      1
                 11          4     2      1     1      3      2
                 12          4     3      2     2      1      3
                 13          5     1      2     3      1      2
                 14          5     2      3     1      2      3
                 15          5     3      1     2      3      1
                 16          6     1      3     2      3      2
                 17          6     2      1     3      1      3
                 18          6     3      2     1      2      1


               We again follow the two-step optimization procedure. First, we conduct
             ANOVA analysis on S/N by using MINITAB. We get the ANOVA table as
             follows:

             Analysis of Variance for S/N, using Adjusted SS for Tests
             Source    DF    Seq SS    Adj SS    Adj MS       F      P
             A          5     89.06     89.06     17.81    0.74  0.662
             B          2      3.80      3.80      1.90    0.08  0.927
             C          2     95.83     95.83     47.92    1.98  0.336
             D          2      9.04      9.04      4.52    0.19  0.843
             E          2     32.12     32.12     16.06    0.66  0.601
             F          2     54.56     54.56     27.28    1.13  0.470
             Error      2     48.41     48.41     24.21
             Total     17    332.82

             The chart in Fig. 15.16 gives percentage contribution of each factor toward S/N.
               Clearly, factors C,A,F,E are important factors contributing to S/N. The fol-
             lowing MINITAB data and the main-effects chart in Fig. 15.17 show that
             A 5 C 2 E 1 F 1 gives the highest signal-to-noise ratio:

             Least Squares Means for S/N
             A     Mean    SE Mean
             1    14.01      2.841
             2    17.38      2.841
             3    12.44      2.841
             4    16.49      2.841
             5    18.60      2.841
             6    13.48      2.841
   599   600   601   602   603   604   605   606   607   608   609