
Page 599 - Design for Six Sigma a Roadmap for Product Development
P. 599
554 Chapter Fifteen
y = 2.60 M
Analysis of Variance
Source DF SS MS F P
Regression 1 13700163 13700163 102203.58 0.000
Residual Error 5 670 134
Total 6 13700833
So
β 2 2.60 2
1
S/N 1 10 log 10 log 12.97
MSE 134
Similarly, we can compute sensitivities and S/N for the other rows in
Table 15.3.
By using the Taguchi two-step optimization procedure, we first conduct
an ANOVA analysis for the S/N ratio using MINITAB:
Analysis of Variance for S/N, using Adjusted SS for Tests
Source DF Seq SS Adj SS Adj MS F P
A 1 49.87 49.87 49.87 1.84 0.308
B 2 3.23 3.23 1.61 0.06 0.944
C 2 5.16 5.16 2.58 0.10 0.913
D 2 9.43 9.43 4.72 0.17 0.852
E 2 5.38 5.38 2.69 0.10 0.910
FG 2 1.45 1.45 0.73 0.03 0.974
H 2 6.59 6.59 3.30 0.12 0.892
I 2 10.85 10.85 5.42 0.20 0.833
Error 2 54.30 54.30 27.15
Total 17 146.26
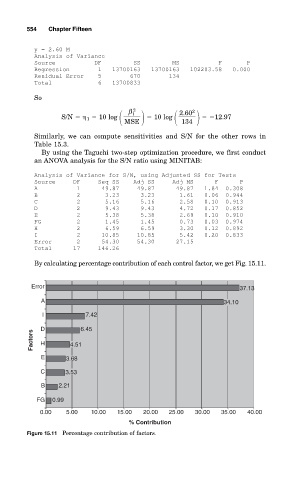
By calculating percentage contribution of each control factor, we get Fig. 15.11.
Error 37.13
A 34.10
I 7.42
D 6.45
Factors H 4.51
E 3.68
C 3.53
B 2.21
FG 0.99
0.00 5.00 10.00 15.00 20.00 25.00 30.00 35.00 40.00
% Contribution
Figure 15.11 Percentage contribution of factors.