
Page 106 - Design for Six Sigma for Service (Six SIGMA Operational Methods)
P. 106
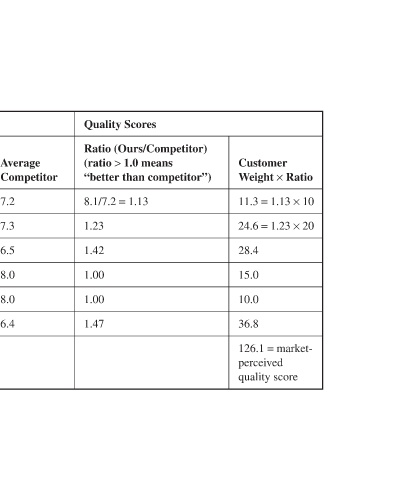
Ratio  × 10  × 20          market-

                           Customer  Weight ×  11.3 = 1.13  24.6 = 1.23  28.4  15.0  10.0  36.8  =  126.1  perceived  quality score


                     Quality Scores  Ratio (Ours/Competitor)  1.0 means  (ratio >  “better than competitor”)  8.1/7.2 = 1.13  1.23  1.42  1.00  1.00  1.47


                           Average  Competitor  7.2  7.3  6.5  8.0  8.0  6.4


                Market-Perceived Quality Profile in Chicken Business
                     Industry Comparison  Perdue (Our  Lowest, Business) (1 =  Highest)  10 =  8.1  9.0  9.2  8.0  8.0  9.4


                      Customer’s  Weight of  Attributes  100) (Total =  10  20  20  15  10  25  100


                Table 5.1  Quality  Attributes  Yellow bird  Meat-to-bone  No pinfeathers  Fresh  Availability  Brand image  Total


        86