
Page 113 - Design for Six Sigma for Service (Six SIGMA Operational Methods)
P. 113
Customer Value Management 91
Low value, high cost
Worse
customer value
Higher price Fair value
zone
Relative price ratio 100 High value,
Lower price customer value low cost
Better
100
Lower score Higher score
Market-perceived quality score
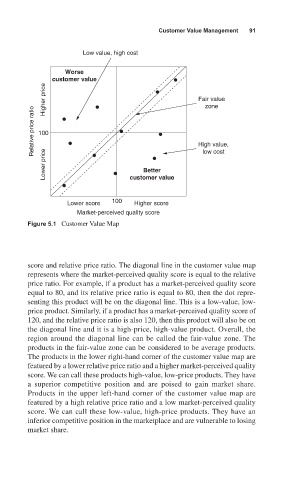
Figure 5.1 Customer Value Map
score and relative price ratio. The diagonal line in the customer value map
represents where the market-perceived quality score is equal to the relative
price ratio. For example, if a product has a market-perceived quality score
equal to 80, and its relative price ratio is equal to 80, then the dot repre-
senting this product will be on the diagonal line. This is a low-value, low-
price product. Similarly, if a product has a market-perceived quality score of
120, and the relative price ratio is also 120, then this product will also be on
the diagonal line and it is a high-price, high-value product. Overall, the
region around the diagonal line can be called the fair-value zone. The
products in the fair-value zone can be considered to be average products.
The products in the lower right-hand corner of the customer value map are
featured by a lower relative price ratio and a higher market-perceived quality
score. We can call these products high-value, low-price products. They have
a superior competitive position and are poised to gain market share.
Products in the upper left-hand corner of the customer value map are
featured by a high relative price ratio and a low market-perceived quality
score. We can call these low-value, high-price products. They have an
inferior competitive position in the marketplace and are vulnerable to losing
market share.