
Page 115 - Design for Six Sigma for Service (Six SIGMA Operational Methods)
P. 115
Customer Value Management 93
250
3
1
200
150 9 5
Relative price 100 11 8 6
13 2
4
12
50
10 7
15
14
0
0 50 100 150
Market-perceived quality score
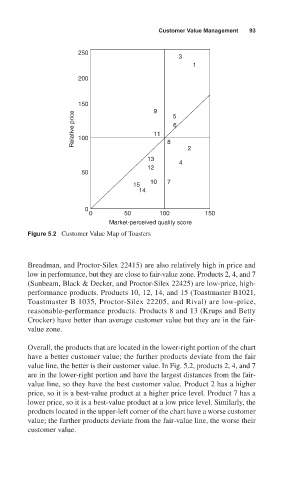
Figure 5.2 Customer Value Map of Toasters
Breadman, and Proctor-Silex 22415) are also relatively high in price and
low in performance, but they are close to fair-value zone. Products 2, 4, and 7
(Sunbeam, Black & Decker, and Proctor-Silex 22425) are low-price, high-
performance products. Products 10, 12, 14, and 15 (Toastmaster B1021,
Toastmaster B 1035, Proctor-Silex 22205, and Rival) are low-price,
reasonable-performance products. Products 8 and 13 (Krups and Betty
Crocker) have better than average customer value but they are in the fair-
value zone.
Overall, the products that are located in the lower-right portion of the chart
have a better customer value; the further products deviate from the fair
value line, the better is their customer value. In Fig. 5.2, products 2, 4, and 7
are in the lower-right portion and have the largest distances from the fair-
value line, so they have the best customer value. Product 2 has a higher
price, so it is a best-value product at a higher price level. Product 7 has a
lower price, so it is a best-value product at a low price level. Similarly, the
products located in the upper-left corner of the chart have a worse customer
value; the further products deviate from the fair-value line, the worse their
customer value.