
Page 117 - Design for Six Sigma for Service (Six SIGMA Operational Methods)
P. 117
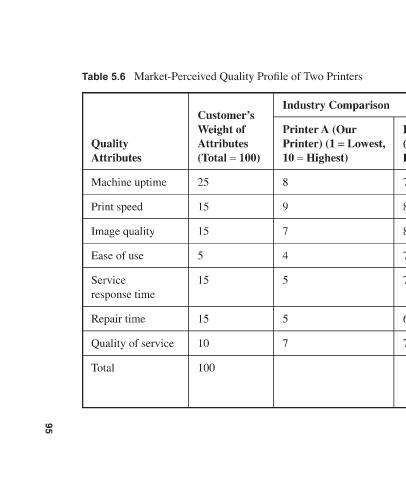
Industry Comparison Quality Scores  Ratio (Ours/Competitor) Printer B Printer A (Our  Customer 1.0 means  (ratio > (Competitor’s Lowest, Printer) (1 =  Ratio Weight × “better than competitor”) Printer) Highest)  10 =  × 25 28.5 = 1.14 1.14 = 8/7  7  8  17.0  1.13  8  9  13.2  0
             Market-Perceived Quality Profile of Two Printers


                   Customer’s  Weight of  Attributes  100) (Total =  25  15  15  5  15  15  10  100


             Table 5.6  Quality  Attributes  Machine uptime  Print speed  Image quality  Ease of use  Service  response time  Repair time  Quality of service  Total


                                                                   95