
Page 112 - Design for Six Sigma for Service (Six SIGMA Operational Methods)
P. 112
×
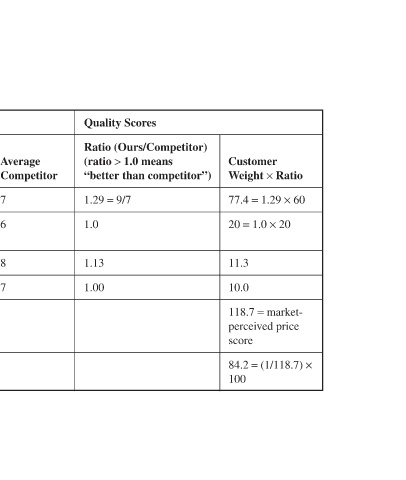
Ratio × 60 × 20 market- (1/118.7)
Customer Weight × 77.4 = 1.29 20 = 1.0 11.3 10.0 = 118.7 perceived price score = 84.2 100
Quality Scores Ratio (Ours/Competitor) 1.0 means (ratio > “better than competitor”) 1.29 = 9/7 1.0 1.13 1.00
Average Lowest, Competitor 7 6 8 7
Market-Perceived Price Profile: Luxury Cars Industry Comparison Customer’s Acura (Our Weight of Business) (1 = Attributes Highest) 10 = 100) (Total = 9 60 6 20 9 10 7 10 100
Table 5.4 Price Satisfaction Attributes Purchase price Trade-in allowance Resale price Finance rates Total Relative price ratio
90