
Page 114 - Design for Six Sigma for Service (Six SIGMA Operational Methods)
P. 114
92 Chapter Five
Example 5.1
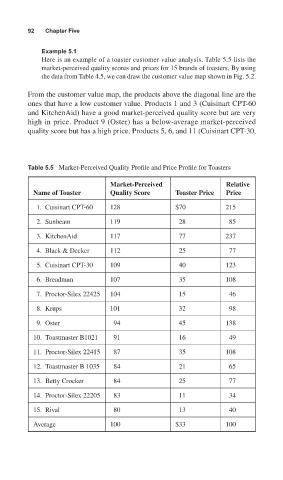
Here is an example of a toaster customer value analysis. Table 5.5 lists the
market-perceived quality scores and prices for 15 brands of toasters. By using
the data from Table 4.5, we can draw the customer value map shown in Fig. 5.2.
From the customer value map, the products above the diagonal line are the
ones that have a low customer value. Products 1 and 3 (Cuisinart CPT-60
and KitchenAid) have a good market-perceived quality score but are very
high in price. Product 9 (Oster) has a below-average market-perceived
quality score but has a high price. Products 5, 6, and 11 (Cuisinart CPT-30,
Table 5.5 Market-Perceived Quality Profile and Price Profile for Toasters
Market-Perceived Relative
Name of Toaster Quality Score Toaster Price Price
1. Cuisinart CPT-60 128 $70 215
2. Sunbeam 119 28 85
3. KitchenAid 117 77 237
4. Black & Decker 112 25 77
5. Cuisinart CPT-30 109 40 123
6. Breadman 107 35 108
7. Proctor-Silex 22425 104 15 46
8. Krups 101 32 98
9. Oster 94 45 138
10. Toastmaster B1021 91 16 49
11. Proctor-Silex 22415 87 35 108
12. Toastmaster B 1035 84 21 65
13. Betty Crocker 84 25 77
14. Proctor-Silex 22205 83 11 34
15. Rival 80 13 40
Average 100 $33 100