
Page 326 - Design of Reinforced Masonry Structures
P. 326
5.46 CHAPTER FIVE
TABLE E5.11 Calculations for Values of Axial Load and Bending Moment for the Interaction
Diagram for Column in Example 5.11 (Excel spreadsheet)
′ f C m C S T fP n fM n
s
Point c in. ′ ε ε ksi kips kips kips kips k-in.
T
s
1 – 0.00207 0.00207 417.6 –
2 23.625 0.00210 −0.00040 −11.7 472.5 71.4 −14.0 398.2 1412
3 19.825 0.00202 0.00000 0.1 396.0 68.7 0.1 331.6 1877
4 17.0 0.00194 0.00042 12.0 340.0 66.0 14.5 279.4 2108
5 14.0 0.00182 0.00104 30.2 280.0 61.8 36.2 218.1 2267
6 10.8 0.00162 0.00208 60.0 216.6 54.9 72.0 142.4 2368
7 10.0 0.00155 0.00246 60.0 200.0 52.3 72.0 128.7 2298
8 8.0 0.00131 0.00370 60.0 160.0 44.1 72.0 94.3 2073
9 6.5 0.00104 0.00513 60.0 130.0 34.5 72.0 66.0 1843
10 5.0 0.00060 0.00741 60.0 100.0 19.3 72.0 33.7 1540
11 4.0 0.00013 0.00989 60.0 80.0 2.8 72.0 7.7 1274
12 3.67 −0.00009 0.01100 60.0 73.4 −3.1 72.0 −1.2 1181
strains, which might be compressive or tensile depending on the position of the neutral axis
in various cases, can be calculated from strain distribution diagrams as follows:
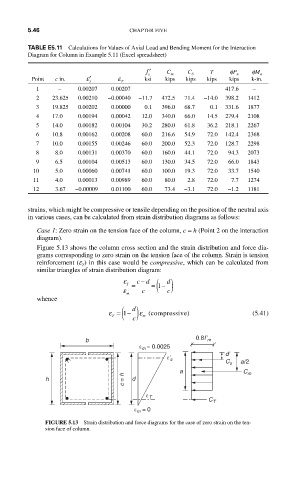
Case 1: Zero strain on the tension face of the column, c = h (Point 2 on the interaction
diagram).
Figure 5.13 shows the column cross section and the strain distribution and force dia-
grams corresponding to zero strain on the tension face of the column. Strain is tension
reinforcement (e ) in this case would be compressive, which can be calculated from
T
similar triangles of strain distribution diagram:
ε cd ( )
−
d
T = = 1 −
ε c c
m
whence
T ( )
d
)
ε = 1 − ε (compressive (5.41)
c m
b 0.8fʹ m
ε m = 0.0025
εʹ s dʹ
C s a/2
a C m
h c = h d
ε T
C T
ε m = 0
FIGURE 5.13 Strain distribution and force diagrams for the case of zero strain on the ten-
sion face of column.