
Page 109 - Designing Sociable Robots
P. 109
breazeal-79017 book March 18, 2002 14:54
90 Chapter 7
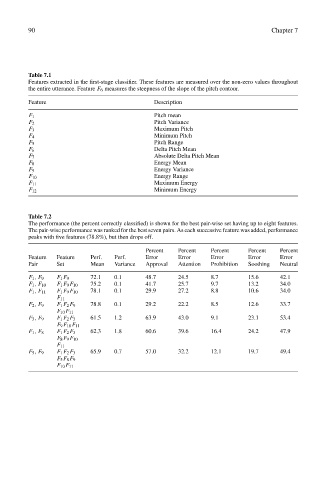
Table 7.1
Features extracted in the first-stage classifier. These features are measured over the non-zero values throughout
the entire utterance. Feature F 6 measures the steepness of the slope of the pitch contour.
Feature Description
F 1 Pitch mean
F 2 Pitch Variance
F 3 Maximum Pitch
F 4 Minimum Pitch
F 5 Pitch Range
F 6 Delta Pitch Mean
F 7 Absolute Delta Pitch Mean
F 8 Energy Mean
F 9 Energy Variance
F 10 Energy Range
F 11 Maximum Energy
F 12 Minimum Energy
Table 7.2
The performance (the percent correctly classified) is shown for the best pair-wise set having up to eight features.
The pair-wise performance was ranked for the best seven pairs. As each successive feature was added, performance
peaks with five features (78.8%), but then drops off.
Percent Percent Percent Percent Percent
Feature Feature Perf. Perf. Error Error Error Error Error
Pair Set Mean Variance Approval Attention Prohibition Soothing Neutral
F 1 , F 9 F 1 F 9 72.1 0.1 48.7 24.5 8.7 15.6 42.1
F 1 , F 10 F 1 F 9 F 10 75.2 0.1 41.7 25.7 9.7 13.2 34.0
F 1 , F 11 F 1 F 9 F 10 78.1 0.1 29.9 27.2 8.8 10.6 34.0
F 11
F 2 , F 9 F 1 F 2 F 9 78.8 0.1 29.2 22.2 8.5 12.6 33.7
F 10 F 11
F 3 , F 9 F 1 F 2 F 3 61.5 1.2 63.9 43.0 9.1 23.1 53.4
F 9 F 10 F 11
F 1 , F 8 F 1 F 2 F 3 62.3 1.8 60.6 39.6 16.4 24.2 47.9
F 8 F 9 F 10
F 11
F 5 , F 9 F 1 F 2 F 3 65.9 0.7 57.0 32.2 12.1 19.7 49.4
F 5 F 8 F 9
F 10 F 11