
Page 189 - Digital Analysis of Remotely Sensed Imagery
P. 189
154 Cha pte r F i v e
167 168 169 170 171 172 173 174 175 176 177 178 179
34 34
35 35
36 +0.02% 36
+0.01%
37 –0.01% 37
+0.00%
+0.02% +0.01% +0.00%
38 –0.01% –0.02% 38
–0.02% 39
39
40 40
41
41
42 42
43
43
+0.02% +0.00% +0.01%
44 44
+0.01%
+0.02%
45 +0.00% –0.01% 45
–0.01%
46 46
47
47
48 48
165 166 167 168 169 170 171 172 173 174 175 176 177 178 179 180
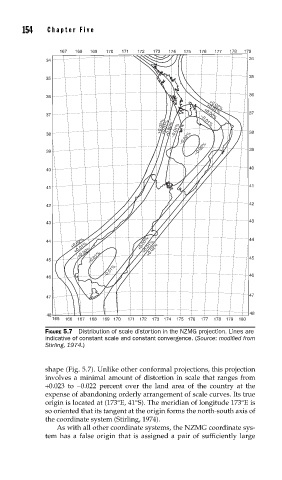
FIGURE 5.7 Distribution of scale distortion in the NZMG projection. Lines are
indicative of constant scale and constant convergence. (Source: modifi ed from
Stirling, 1974.)
shape (Fig. 5.7). Unlike other conformal projections, this projection
involves a minimal amount of distortion in scale that ranges from
+0.023 to −0.022 percent over the land area of the country at the
expense of abandoning orderly arrangement of scale curves. Its true
origin is located at (173°E, 41°S). The meridian of longitude 173°E is
so oriented that its tangent at the origin forms the north-south axis of
the coordinate system (Stirling, 1974).
As with all other coordinate systems, the NZMG coordinate sys-
tem has a false origin that is assigned a pair of sufficiently large