
Page 213 - Digital Analysis of Remotely Sensed Imagery
P. 213
15+
N
1+
Auckland
19+ NEW ZEALAND
North Island
14+
2+
200 km
+ 16+
17
18+ 3+
20+ 4 +
12+ +
8
10+
13+ 7 +
+9
N 6 +
5 +
11+
0 5 km
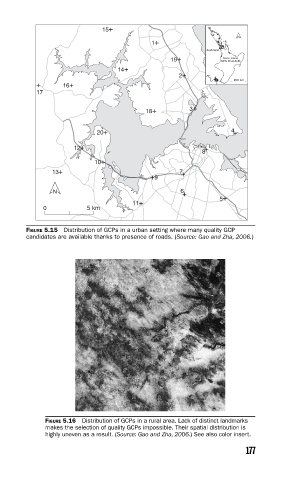
FIGURE 5.15 Distribution of GCPs in a urban setting where many quality GCP
candidates are available thanks to presence of roads. (Source: Gao and Zha, 2006.)
FIGURE 5.16 Distribution of GCPs in a rural area. Lack of distinct landmarks
makes the selection of quality GCPs impossible. Their spatial distribution is
highly uneven as a result. (Source: Gao and Zha, 2006.) See also color insert.
177