
Page 218 - Digital Analysis of Remotely Sensed Imagery
P. 218
182 Cha pte r F i v e
a: SPOT PAN
8
7 6 Rural
Residual (in pixel size) 5 4 3
Urban
1 2
0
100 95 90 85 80 75 70 65 60 55 50
b: SPOT XL
3 Rural
2.5
Residual (in pixel size) 1.5 2 1 Urban
0.5
0
100 95 90 85 80 75 70 65 60 55 50
C: Landsat TM
2 Rural
Residual (in pixel size) 1.5 1 Urban
0.5
0
100 95 90 85 80 75 70 65 60 55 50
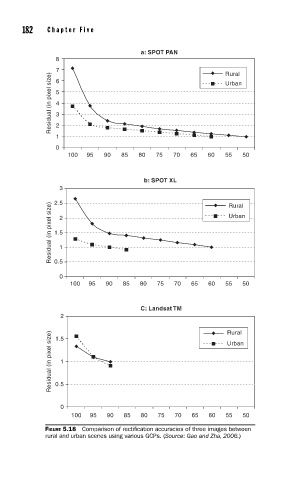
FIGURE 5.18 Comparison of rectifi cation accuracies of three images between
rural and urban scenes using various GCPs. (Source: Gao and Zha, 2006.)