
Page 92 - Dynamic Vision for Perception and Control of Motion
P. 92
3 Subjects and Subject Classes
76
lyzing dynamical motion in response to control input and perturbations; only a very
brief survey is given here. Mitschke (1988, 1990) is the standard reference in this
field in German. (The announced reference [Giampiero 2007] may become a coun-
terpart in English.)
3.4.2.1 Longitudinal Control Variables
For longitudinal acceleration, the following relation holds:
2
F
F
F
F
dx / dt 2 { F F + }/ m . (3.8)
a r g b c p
2
F a = aerodynamic forces proportional to velocity squared (V ),
F r = roll-resistance forces from the wheels,
F g = weight component in hilly terrain (í m·g·sin(Ȗ); Ȗ = slope angle);
F b = braking force, depends on friction coefficient ȝ (tire – ground), normal
force on tire, and on brake pressure applied (control u lon1);
F c = longitudinal force due to curvature of trajectory,
F p = propulsive forces from engine torque through wheels (control u lon2),
m = vehicle mass.
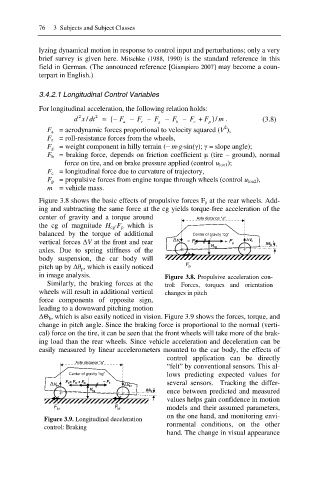
Figure 3.8 shows the basic effects of propulsive forces F p at the rear wheels. Add-
ing and subtracting the same force at the cg yields torque-free acceleration of the
center of gravity and a torque around Axle distance “a”
the cg of magnitude H cg·F p which is
balanced by the torque of additional Center of gravity “cg”
vertical forces ǻV at the front and rear ǻV r í F p + F p ǻV f
H cg ǻș p
axles. Due to spring stiffness of the + +
body suspension, the car body will
pitch up by ǻș p, which is easily noticed F p
in image analysis. Figure 3.8. Propulsive acceleration con-
Similarly, the braking forces at the trol: Forces, torques and orientation
wheels will result in additional vertical changes in pitch
force components of opposite sign,
leading to a downward pitching motion
ǻĬ b, which is also easily noticed in vision. Figure 3.9 shows the forces, torque, and
change in pitch angle. Since the braking force is proportional to the normal (verti-
cal) force on the tire, it can be seen that the front wheels will take more of the brak-
ing load than the rear wheels. Since vehicle acceleration and deceleration can be
easily measured by linear accelerometers mounted to the car body, the effects of
control application can be directly
Axle distance “a”
“felt” by conventional sensors. This al-
lows predicting expected values for
Center of gravity “cg”
several sensors. Tracking the differ-
F b = F bf + F br í F b
ǻV br ǻV bf
H cg ǻș b
+ + ence between predicted and measured
values helps gain confidence in motion
F br F bf models and their assumed parameters,
on the one hand, and monitoring envi-
Figure 3.9. Longitudinal deceleration
ronmental conditions, on the other
control: Braking
hand. The change in visual appearance