
Page 95 - Dynamic Vision for Perception and Control of Motion
P. 95
3.4 Behavioral Capabilities for Locomotion 79
At the end of a control input phase starting from Ȝ 0 = 0 with constant steering
rate over a period T SR, the maximal lateral acceleration is
a y , max V 2 A T SR / a . (3.16)
For passenger comfort in public transportation, horizontal accelerations are usu-
ally kept below 0.1 g § 1 m/s². In passenger cars, levels of 0.2 to 0.4 g are com-
monly encountered. With a typical steering rate of |A| § 1.15 °/s = 0.02 rad/s, the
lateral acceleration level of § 0.2 g (2 m/s²) is achieved in a maneuver-time
dubbed T 2. For the test vehicle “VaMP”, a Mercedes sedan 500-SEL with an axle
distance a = 3.14 m, this maneuver time T 2 (divided by a factor of 2 for scaling in
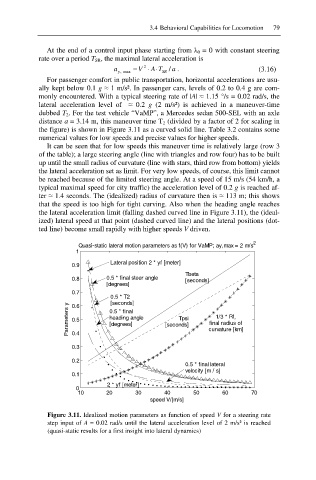
the figure) is shown in Figure 3.11 as a curved solid line. Table 3.2 contains some
numerical values for low speeds and precise values for higher speeds.
It can be seen that for low speeds this maneuver time is relatively large (row 3
of the table); a large steering angle (line with triangles and row four) has to be built
up until the small radius of curvature (line with stars, third row from bottom) yields
the lateral acceleration set as limit. For very low speeds, of course, this limit cannot
be reached because of the limited steering angle. At a speed of 15 m/s (54 km/h, a
typical maximal speed for city traffic) the acceleration level of 0.2 g is reached af-
ter § 1.4 seconds. The (idealized) radius of curvature then is § 113 m; this shows
that the speed is too high for tight curving. Also when the heading angle reaches
the lateral acceleration limit (falling dashed curved line in Figure 3.11), the (ideal-
ized) lateral speed at that point (dashed curved line) and the lateral positions (dot-
ted line) become small rapidly with higher speeds V driven.
2
Quasi-static lateral motion parameters as f(V) for VaMP; ay,max = 2 m/s
1
Lateral position 2 * yf [meter]
0.9
Tbeta
0.8 0.5 * final steer angle [seconds]
[degrees]
0.7
0.5 * T2
[seconds]
Parameters y 0.5 0.5 * final [seconds] curvature [km]
0.6
1/3 * Rf,
heading angle
Tpsi
final radius of
[degrees]
0.4
0.3
0.2
0.5 * final lateral
velocity [m / s]
0.1
2 * yf [meter]
0
10 20 30 40 50 60 70
speed V/[m/s]
Figure 3.11. Idealized motion parameters as function of speed V for a steering rate
step input of A = 0.02 rad/s until the lateral acceleration level of 2 m/s² is reached
(quasi-static results for a first insight into lateral dynamics)