
Page 234 - Earth's Climate Past and Future
P. 234
210 PART IV • Deglacial Climate Change
The Glacial World: More Ice, Less Gas two factors account for the very different glacial-
maximum world.
Even though the glacial world was icy, cold, dry, windy,
and sparsely vegetated, from a tectonic perspective it 12-1 Project CLIMAP: Reconstructing the Last
was nearly identical to the world today. The continents Glacial Maximum
had moved to essentially their modern positions, and
plateaus and mountains were at very nearly the same Cooperative efforts to reconstruct past climates began
elevations as they are today. In a sense, this glacial world in the 1970s, when a large interdisciplinary effort called
represented an alternative version of today’s Earth, the the CLIMAP (Climate Mapping and Prediction)
product of a giant experiment run by the climate system Project reconstructed the surface of Earth at the
in response to changes in several forcing factors. As we last glacial maximum. Led by the marine geologists
saw in Parts II and III, the three factors with the great- John Imbrie and Jim Hays and the geochemist Nick
est potential to account for differences from modern Shackleton, CLIMAP drew on the expertise of scientists
climate conditions were larger ice sheets, lower CO with specialized knowledge of ice sheets, windblown
2
levels, and changes in seasonal insolation. deposits, marine sediments, vegetation, and climate
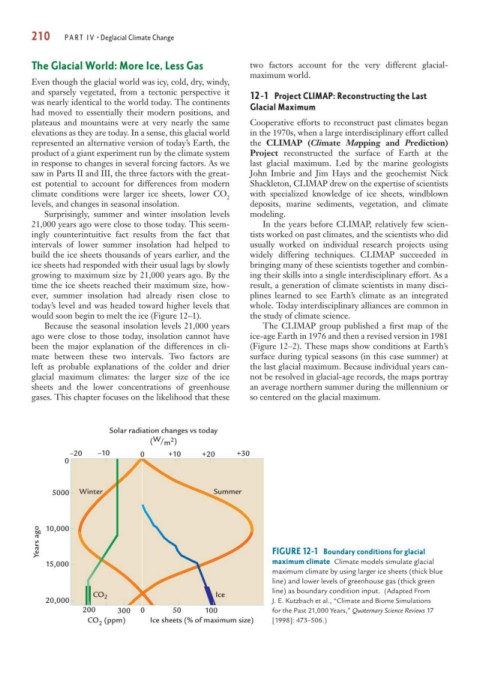
Surprisingly, summer and winter insolation levels modeling.
21,000 years ago were close to those today. This seem- In the years before CLIMAP, relatively few scien-
ingly counterintuitive fact results from the fact that tists worked on past climates, and the scientists who did
intervals of lower summer insolation had helped to usually worked on individual research projects using
build the ice sheets thousands of years earlier, and the widely differing techniques. CLIMAP succeeded in
ice sheets had responded with their usual lags by slowly bringing many of these scientists together and combin-
growing to maximum size by 21,000 years ago. By the ing their skills into a single interdisciplinary effort. As a
time the ice sheets reached their maximum size, how- result, a generation of climate scientists in many disci-
ever, summer insolation had already risen close to plines learned to see Earth’s climate as an integrated
today’s level and was headed toward higher levels that whole. Today interdisciplinary alliances are common in
would soon begin to melt the ice (Figure 12–1). the study of climate science.
Because the seasonal insolation levels 21,000 years The CLIMAP group published a first map of the
ago were close to those today, insolation cannot have ice-age Earth in 1976 and then a revised version in 1981
been the major explanation of the differences in cli- (Figure 12–2). These maps show conditions at Earth’s
mate between these two intervals. Two factors are surface during typical seasons (in this case summer) at
left as probable explanations of the colder and drier the last glacial maximum. Because individual years can-
glacial maximum climates: the larger size of the ice not be resolved in glacial-age records, the maps portray
sheets and the lower concentrations of greenhouse an average northern summer during the millennium or
gases. This chapter focuses on the likelihood that these so centered on the glacial maximum.
Solar radiation changes vs today
2
( W / m )
–20 –10 0 +10 +20 +30
0
5000 Winter Summer
Years ago 10,000 FIGURE 12-1 Boundary conditions for glacial
15,000 maximum climate Climate models simulate glacial
maximum climate by using larger ice sheets (thick blue
line) and lower levels of greenhouse gas (thick green
line) as boundary condition input. (Adapted From
CO 2 Ice
20,000 J. E. Kutzbach et al., “Climate and Biome Simulations
200 300 0 50 100 for the Past 21,000 Years,” Quaternary Science Reviews 17
CO (ppm) Ice sheets (% of maximum size) [1998]: 473–506.)
2