
Page 235 - Earth's Climate Past and Future
P. 235
CHAPTER 12 • Last Glacial Maximum 211
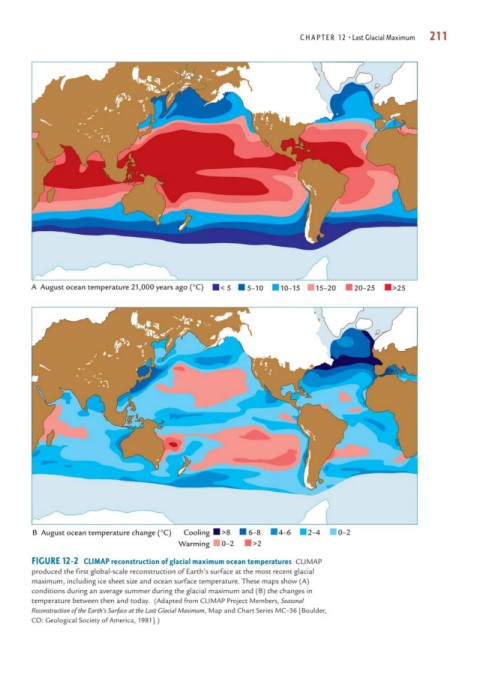
A August ocean temperature 21,000 years ago (°C) < 5 5–10 10–15 15–20 20–25 >25
B August ocean temperature change (°C) Cooling >8 6–8 4–6 2–4 0–2
Warming 0–2 >2
FIGURE 12-2 CLIMAP reconstruction of glacial maximum ocean temperatures CLIMAP
produced the first global-scale reconstruction of Earth’s surface at the most recent glacial
maximum, including ice sheet size and ocean surface temperature. These maps show (A)
conditions during an average summer during the glacial maximum and (B) the changes in
temperature between then and today. (Adapted from CLIMAP Project Members, Seasonal
Reconstruction of the Earth’s Surface at the Last Glacial Maximum, Map and Chart Series MC–36 [Boulder,
CO: Geological Society of America, 1981].)